Monitoring & Forecast
The Monitoring & Forecast component provides an interactive and comprehensive tool for monitoring and forecasting IP traffic data. It allows users to visualize real-time traffic trends, predict future behavior based on historical data, and manage traffic samples efficiently.
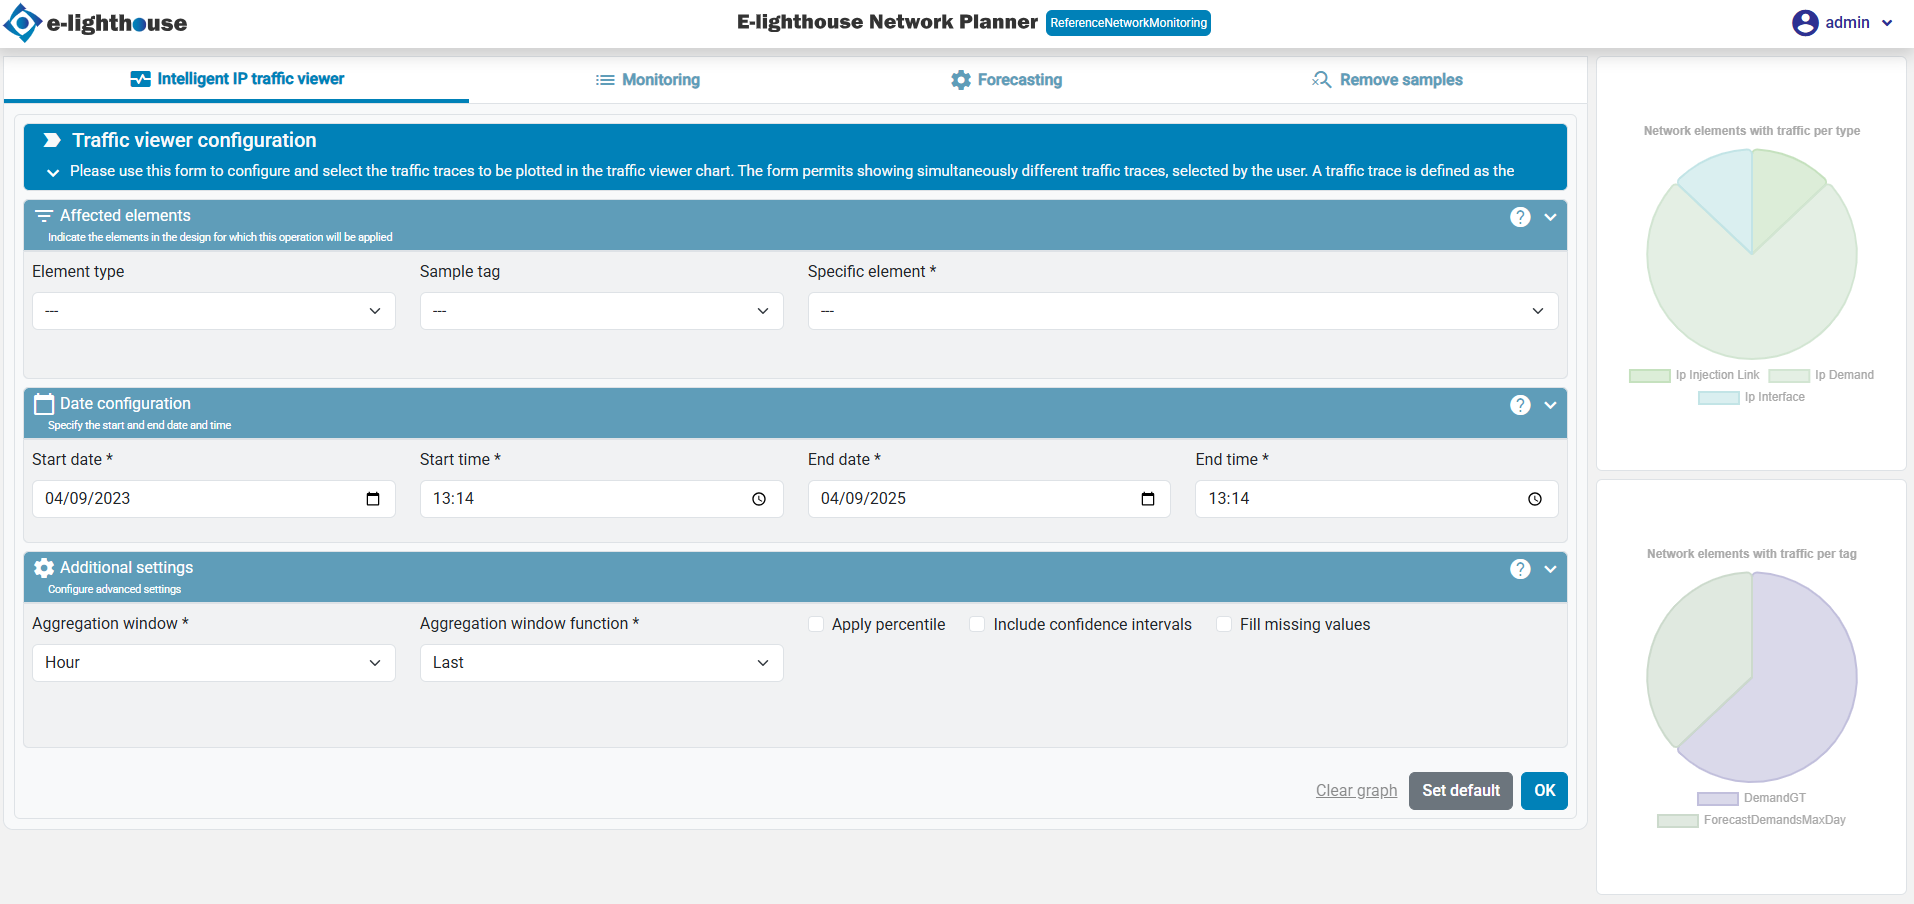
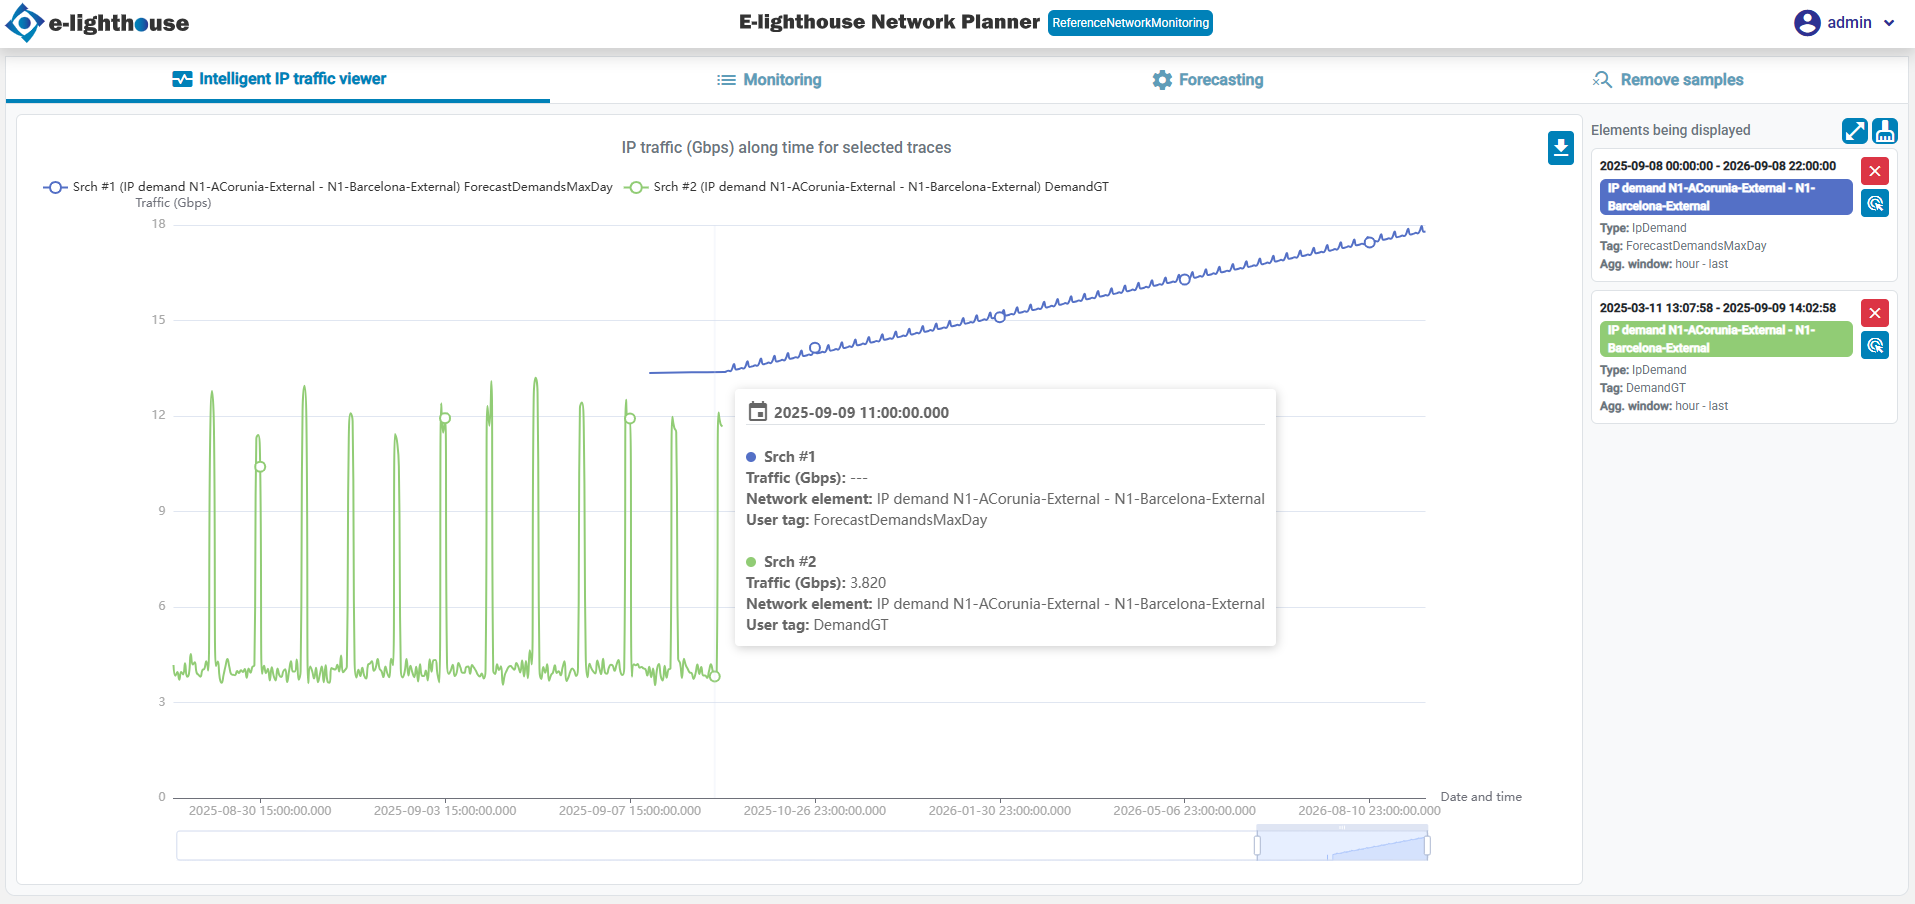
Intelligent IP traffic viewer
This tab allows users to configure and visualize different traffic traces.
Key Features
- A configuration form to select and filter traffic traces.
- A main graph displaying selected traffic data.
- A list of active traffic elements to keep track of monitored items.
Traffic viewer configuration
This feature provides a detailed view of IP traffic over time for the selected elements. Users can configure the time range, element types, and traffic tags to tailor the displayed data to their needs. If no data is available, an alert will guide users to set up the required configurations.
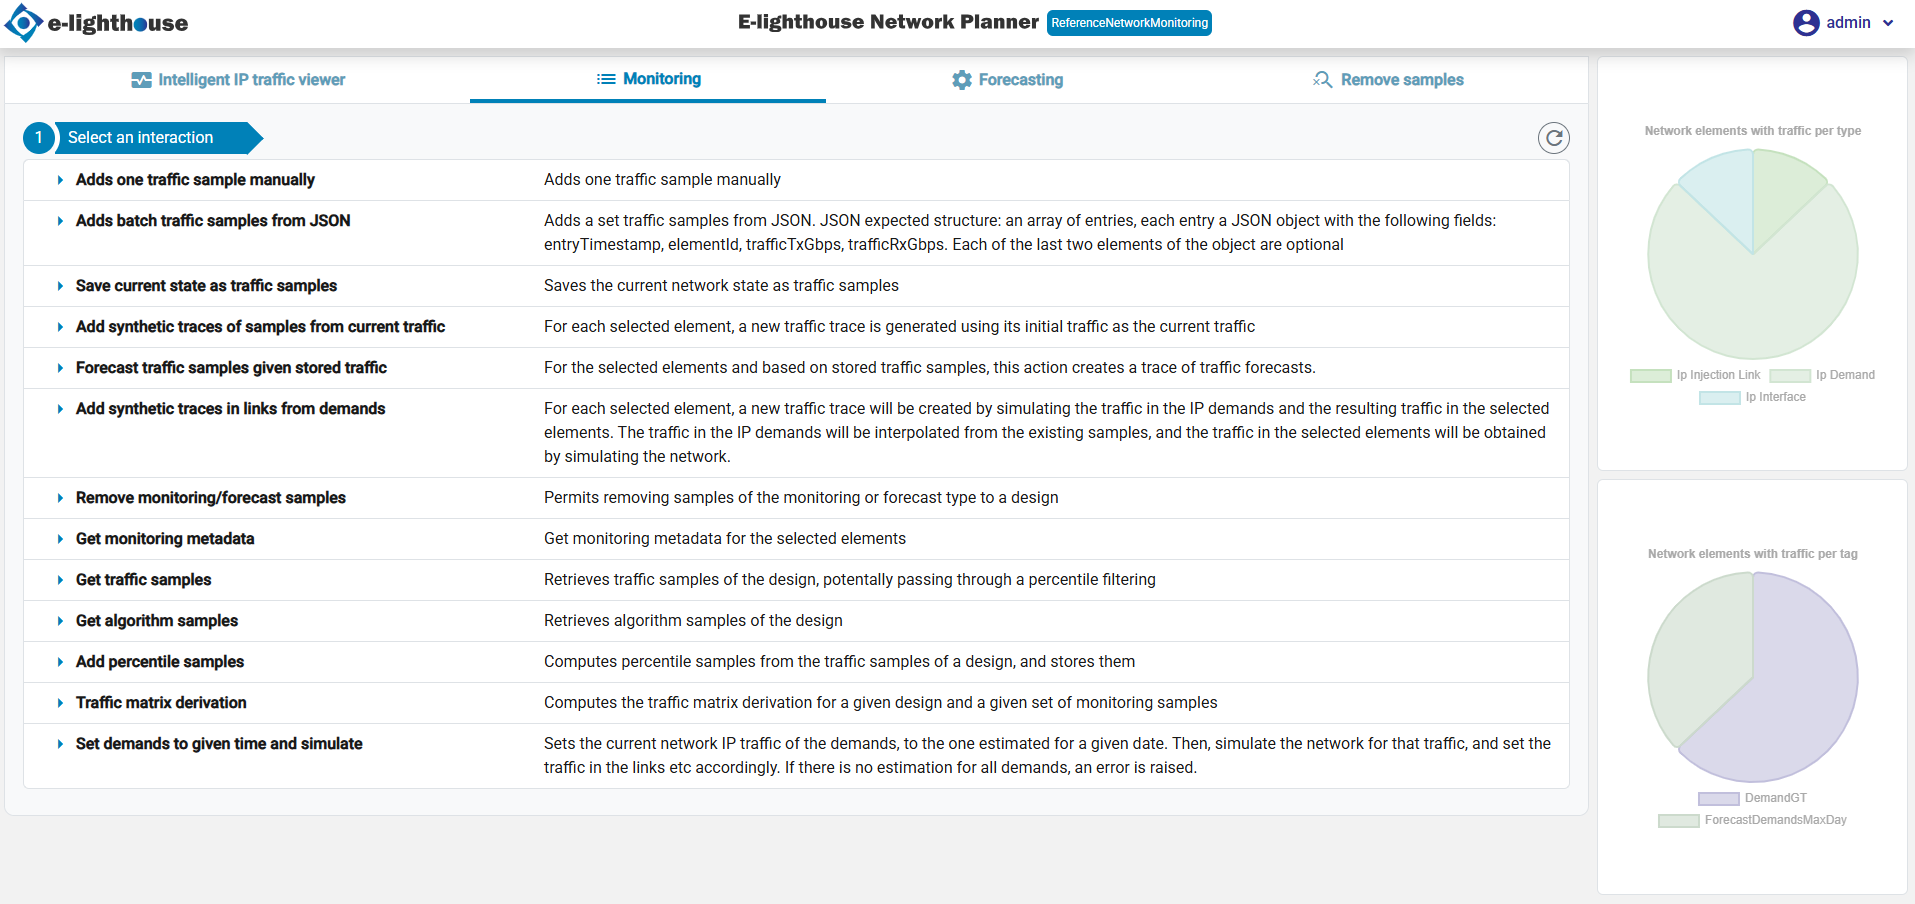
Monitoring
This tab focuses on advanced monitoring and forecasting tools. Users can analyze traffic patterns, identify trends, and gain insights into future network demands.
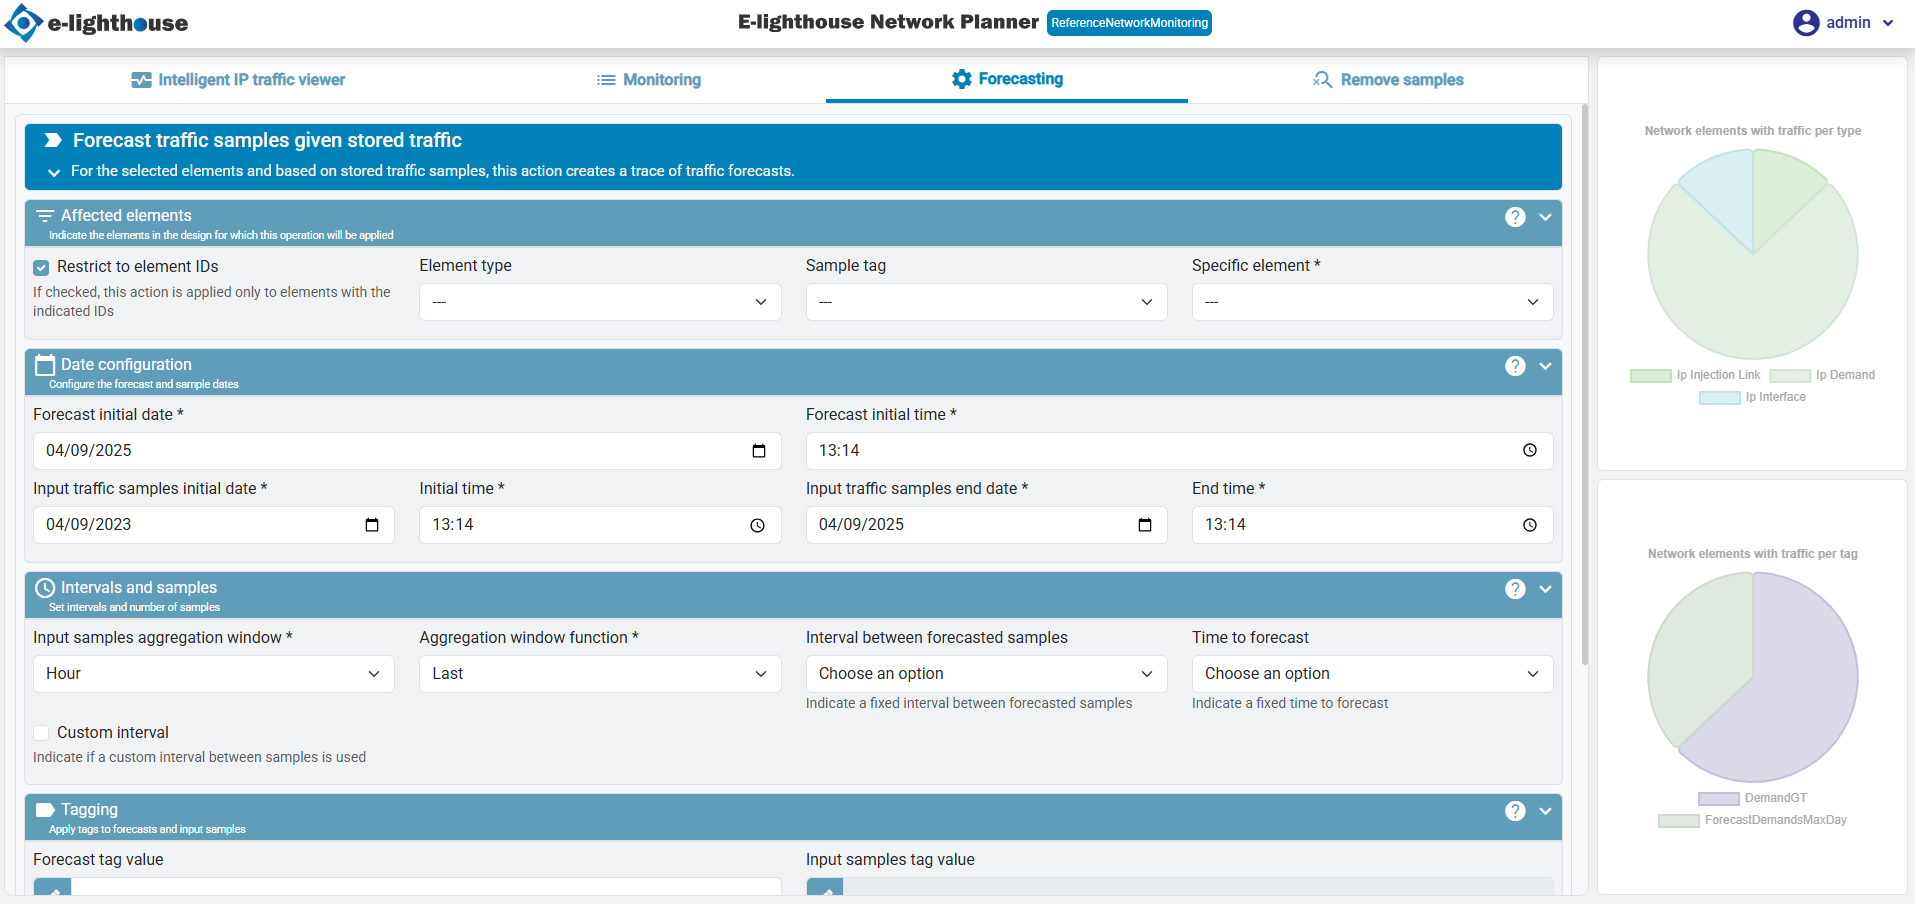
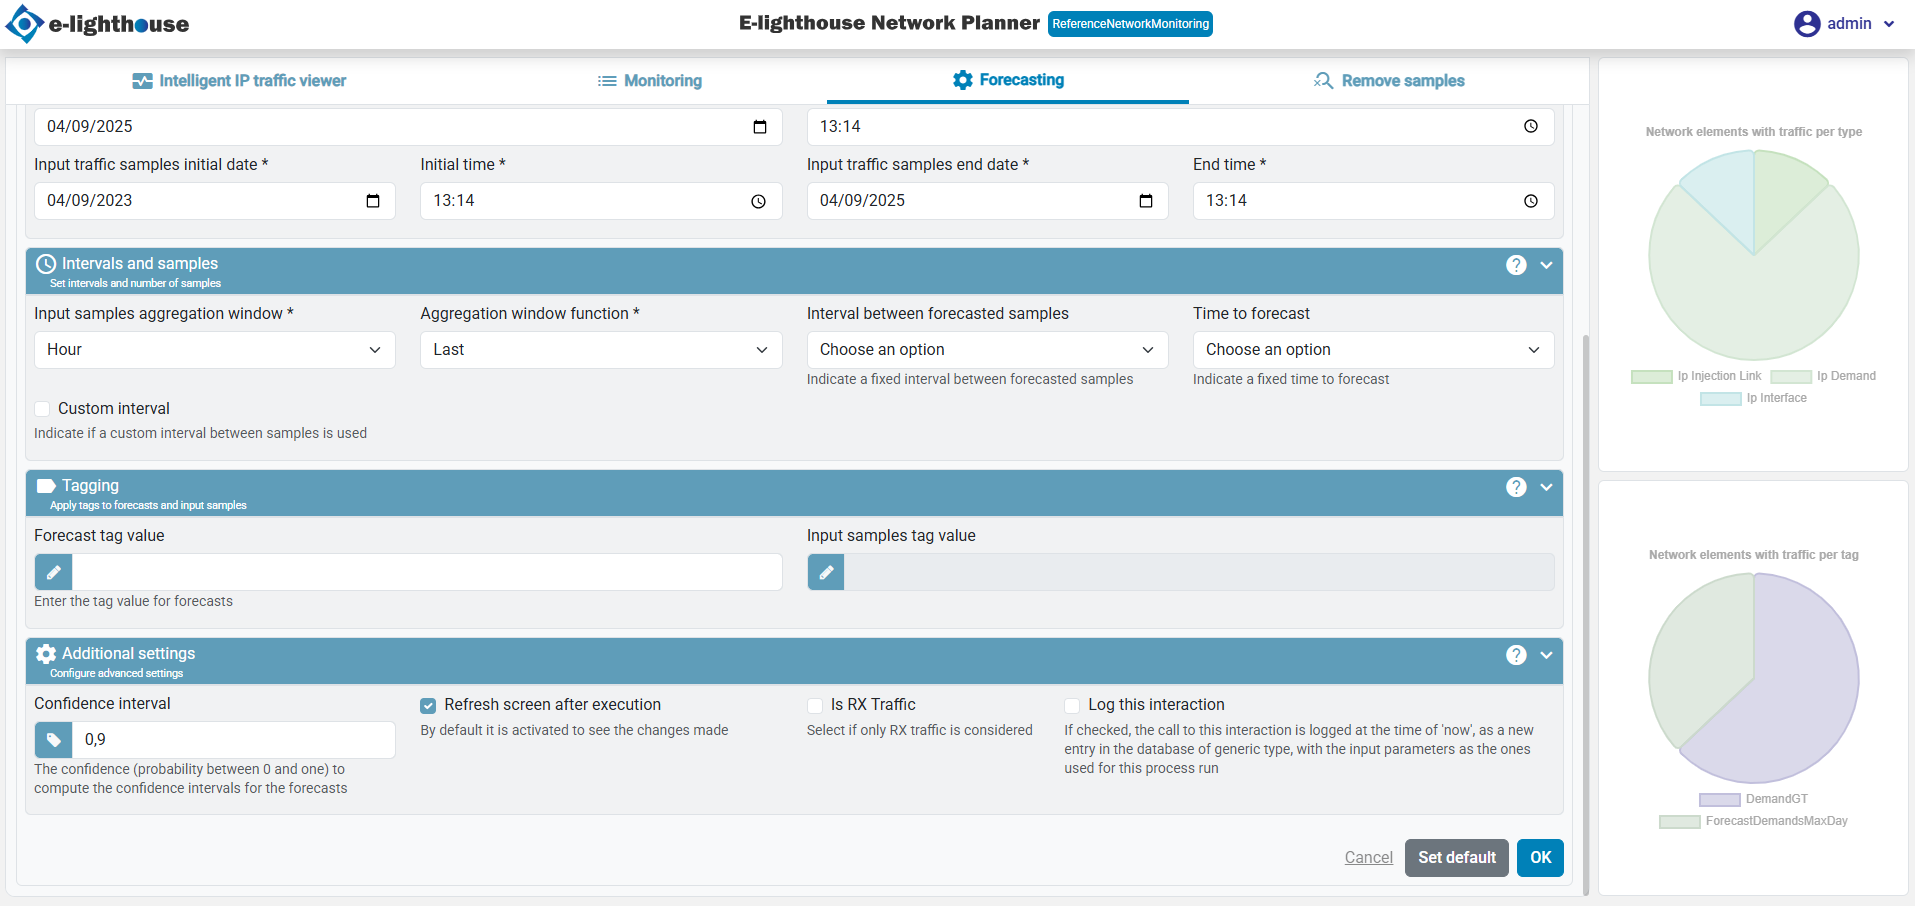
Forecasting
This tab enables users to predict future traffic trends based on historical data.
Key Features
- A forecast configuration form to define prediction parameters.
- Automated generation of forecast graphs.
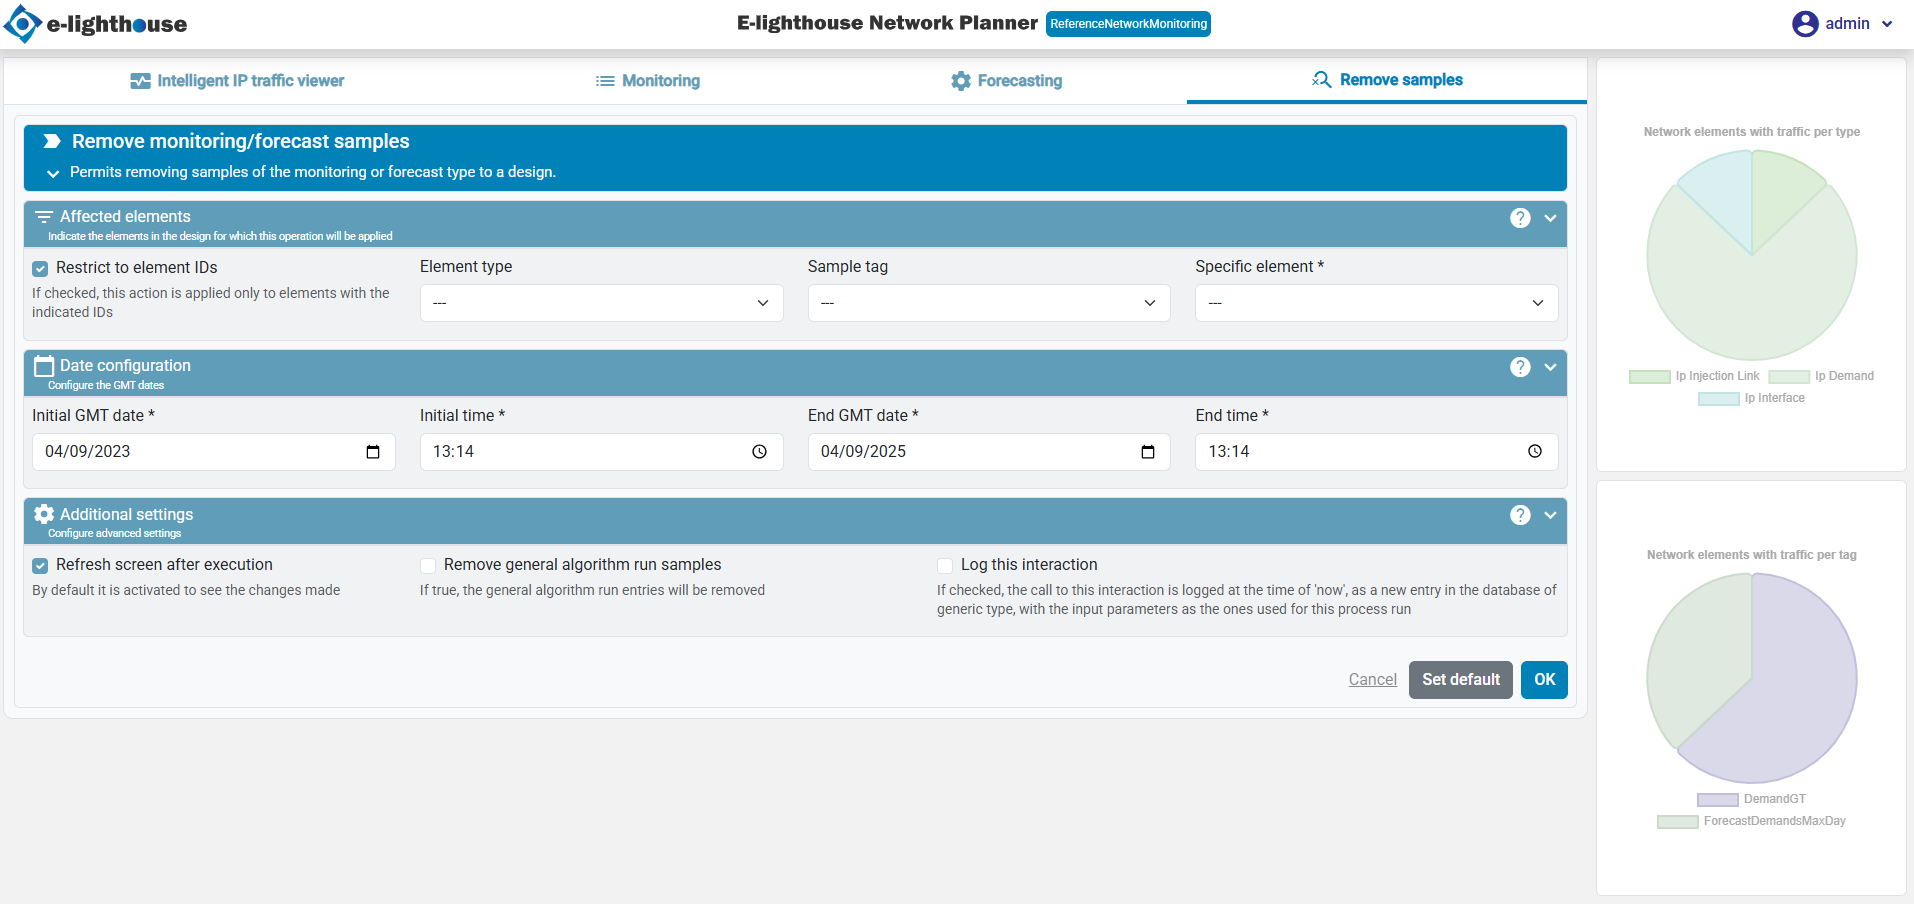
Remove Samples
This tab allows users to remove stored monitoring or forecast samples.
Key Features
- Selection of specific samples to be removed.
- Confirmation prompts to prevent accidental deletions.
Data Visualization
The Monitoring & Forecast component includes two primary types of charts:
Main Chart
- Displays real-time and historical traffic data.
- Interactive elements allow users to explore detailed insights.
- Supports zooming, legend customization, and data export.
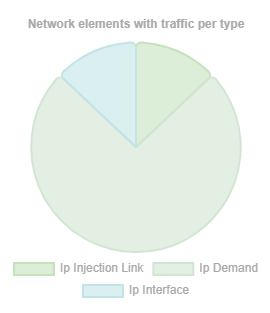
Summary charts
- Provides an overview of traffic distribution by type and tag.
- Helps users quickly identify trends and anomalies.
Network elements with traffic per type
This pie chart provides a breakdown of network traffic by the type of element. It helps users quickly understand which types of network elements are generating the most traffic.
- Use Case: Identify high-traffic element types to optimize network performance.
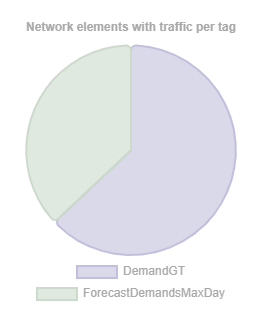
Network elements with traffic per tag
This chart categorizes traffic based on tags assigned to network elements. Tags can represent user-defined classifications or priorities.
- Use Case: Analyze traffic distribution among different categories to assess network utilization.
By leveraging these tools, users can efficiently monitor, analyze, and predict IP traffic, ensuring optimal network performance and resource planning.