Topology window
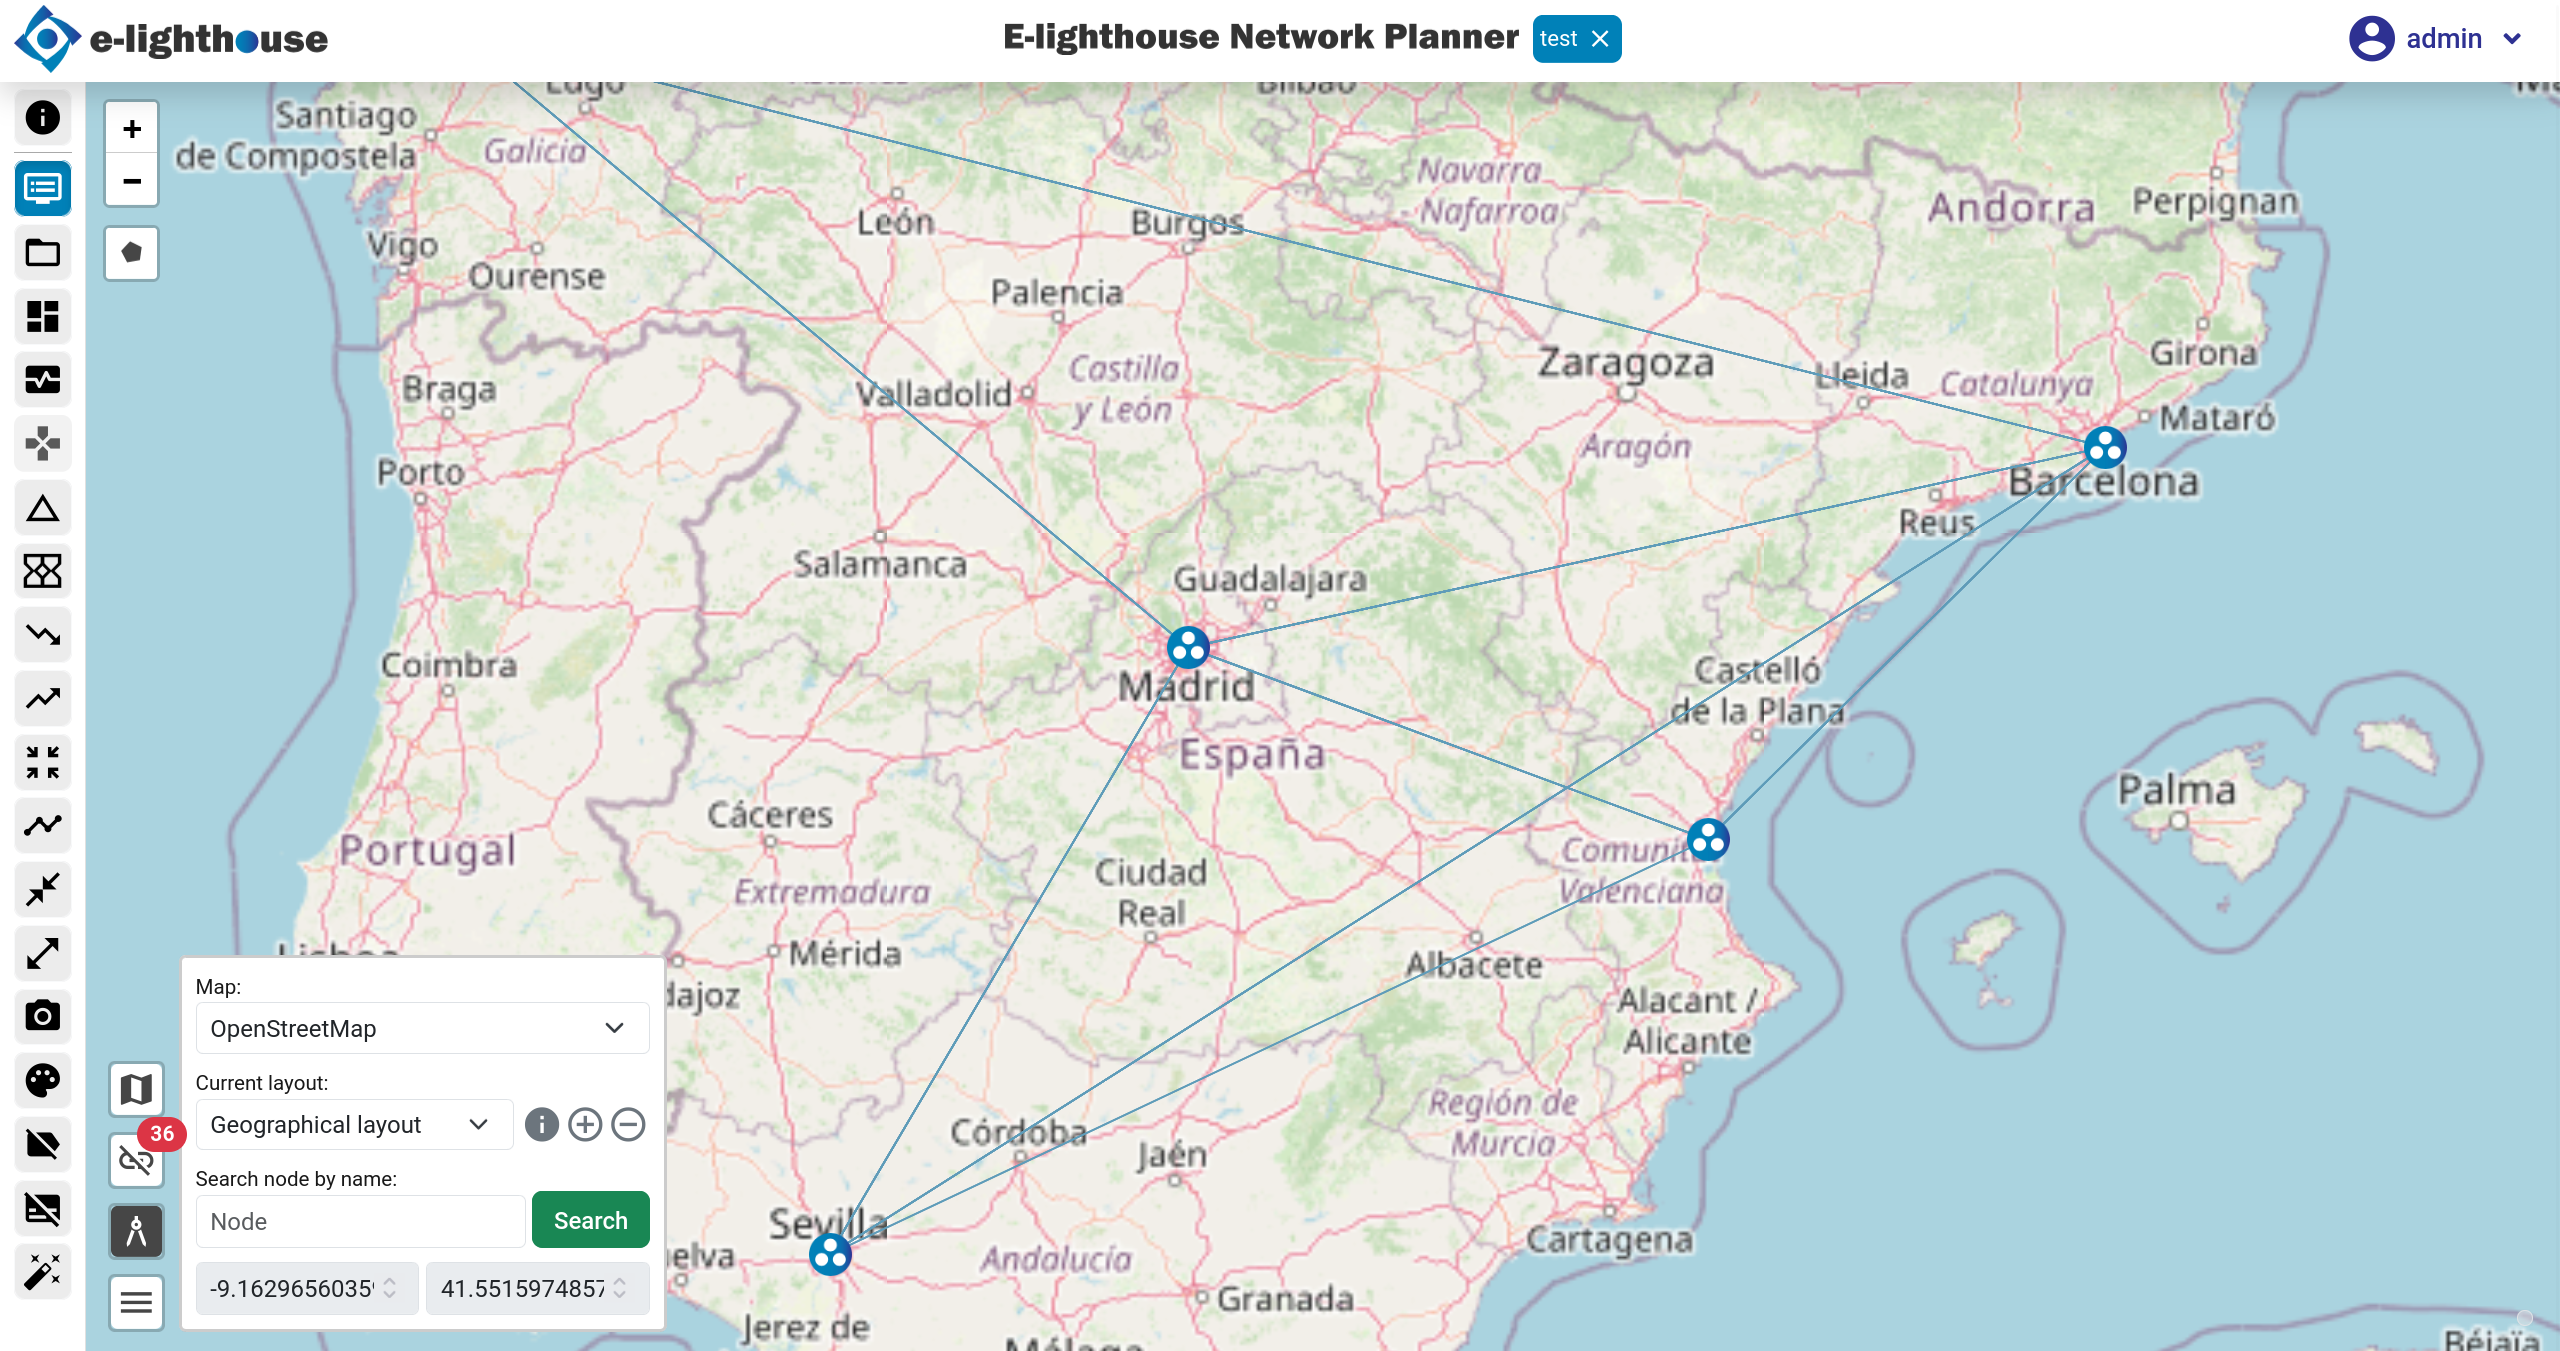
ENP Topology panel is the main window of the GUI. Its main role is providing a user-configurable visualization of the network, in give access to other main functionalities.
As shown in the figure the Topology panel includes button bars and other information that will be described in the following sections:
Canvas
The topology canvas displays the network nodes and links in a graphical form, and gives graphical access to several options.
This panel permits a graphical visualization of the network nodes and links between them, with the following characteristics:
Map / clear view
In the map view, the node positions are shown as in the canvas located in a geographical map.
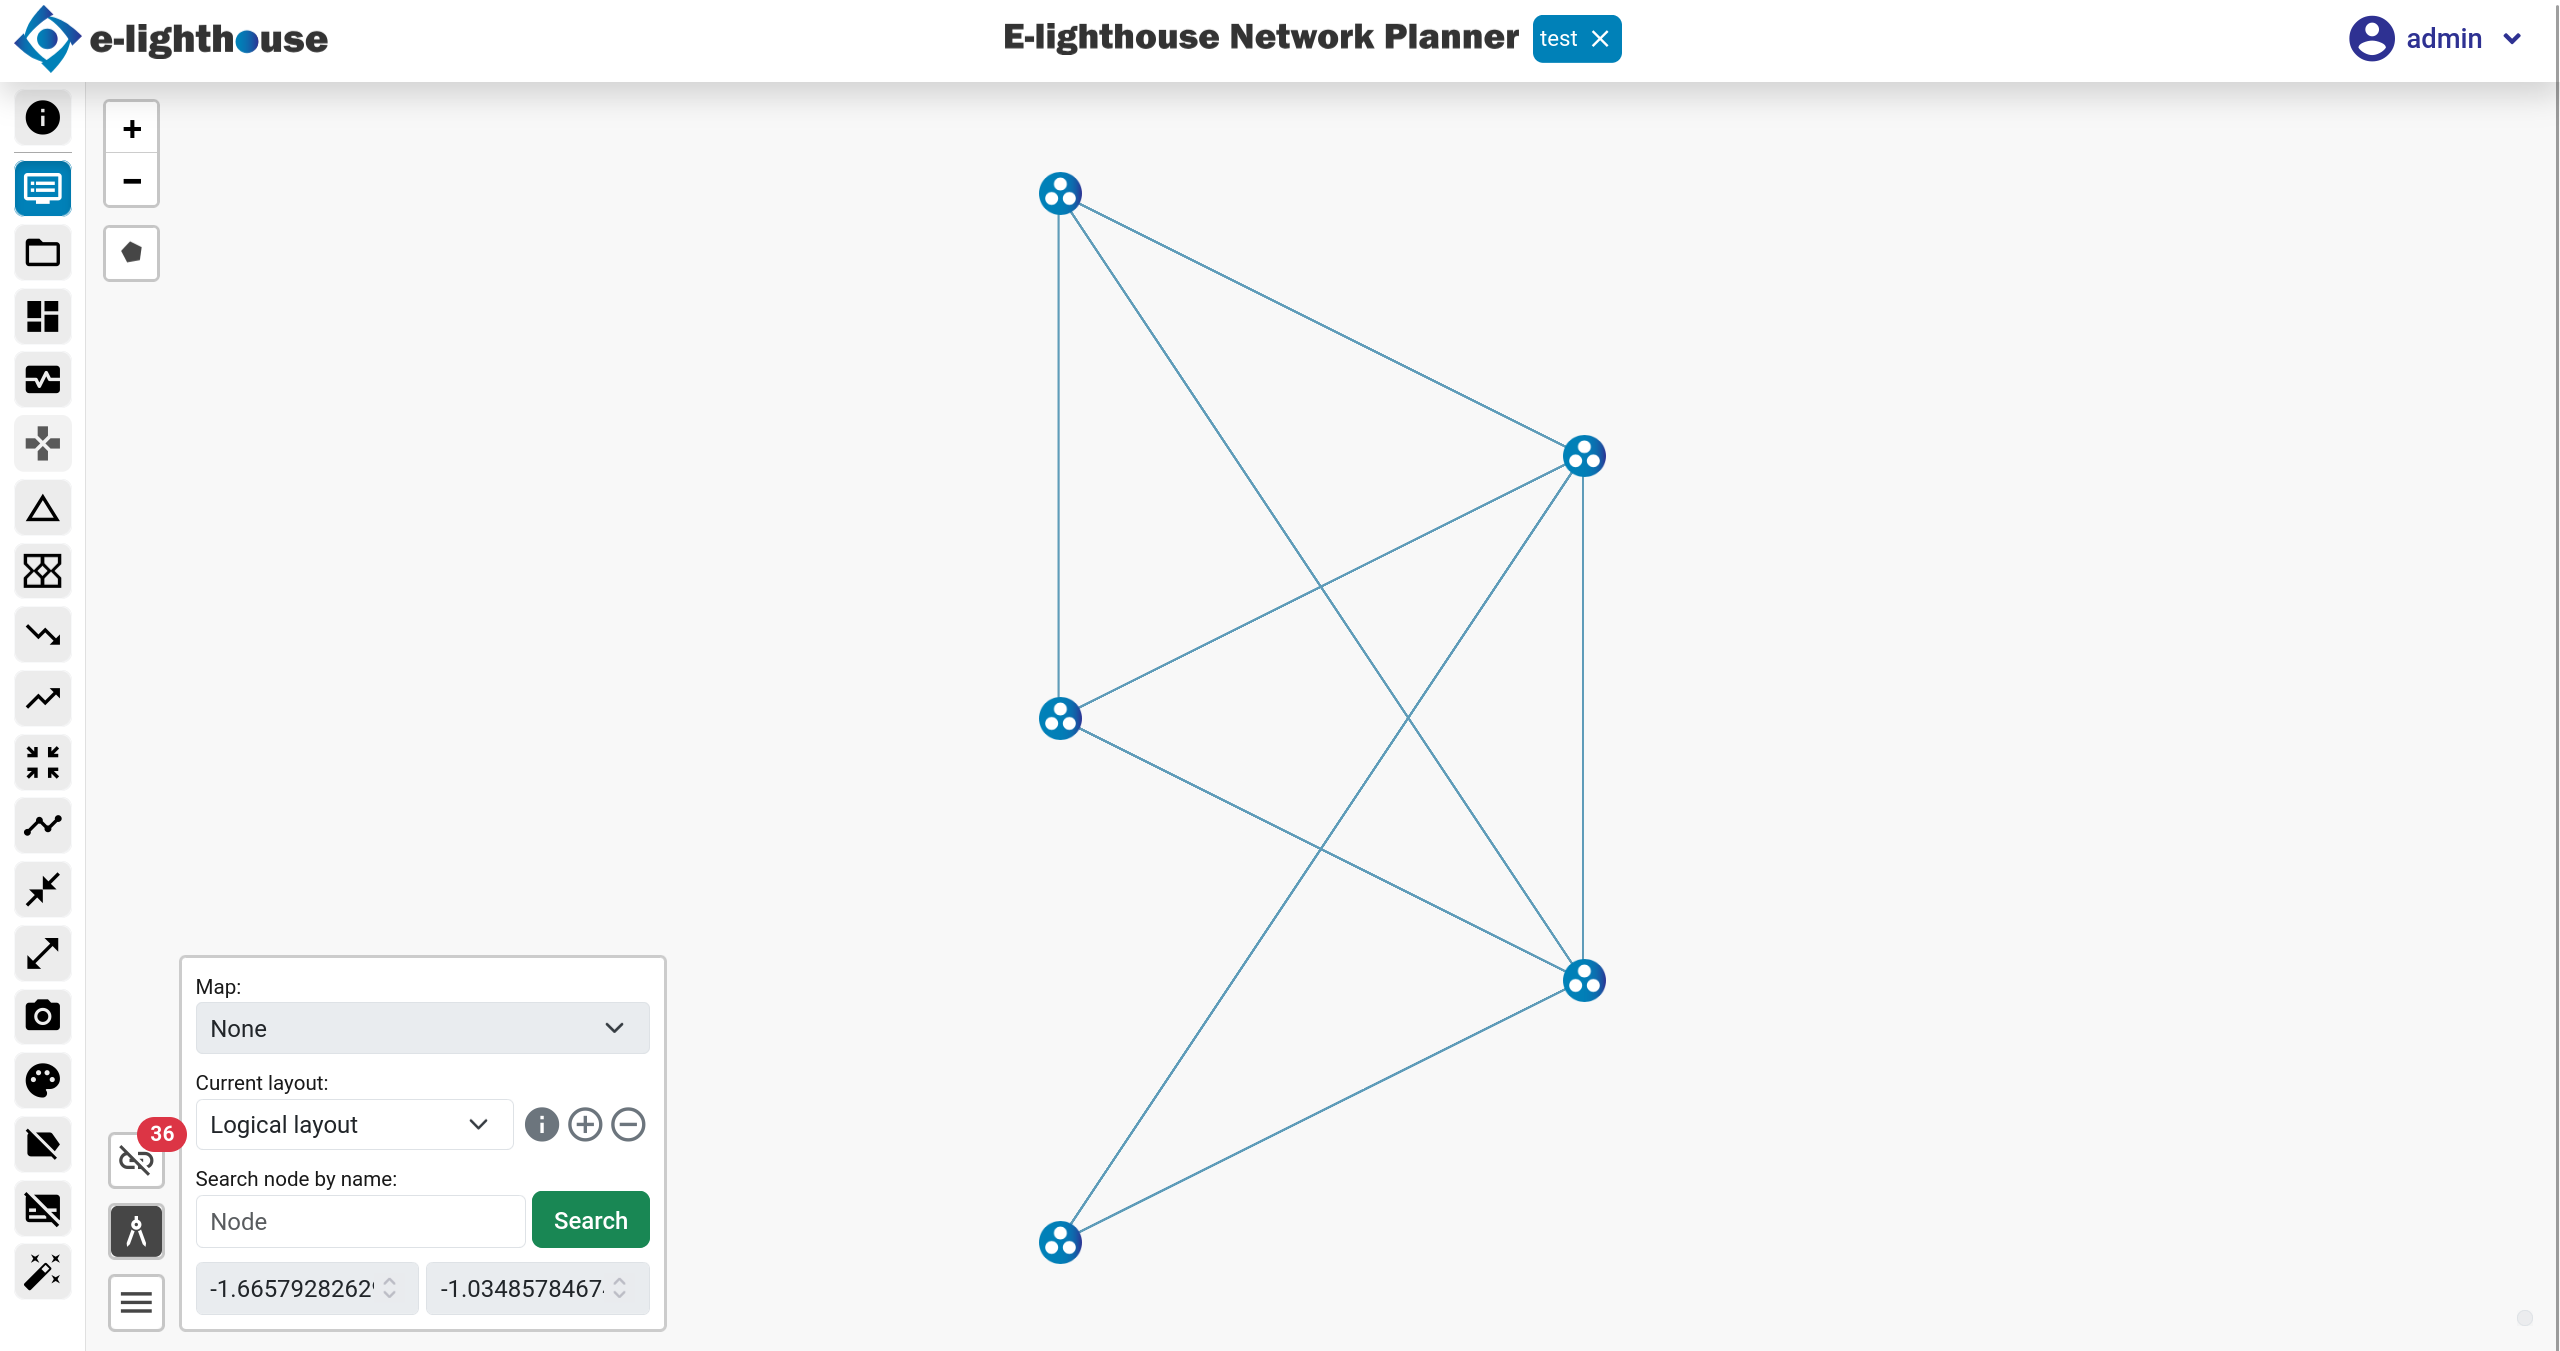
In contrast, in the clear view, the network nodes are plotted over an empty background.
The user can activate and deactivate the map view by choosing the corresponding option from the "Current layout" selector found in Topology panel.
Layout view
A network layout is an arrangement of the nodes in (X,Y) positions in the canvas. The canvas on the topology panel displays the currently active layout for the network topology design.
- Geographical layout. In any ENP design, the so-called geographical layout displays each node in a coordinate associated to its longitude and latitude.
- User-defined layouts (Logical layout). Additionally, the user can create as many other layouts as he/she wishes, as described in Topology panel. Layouts are typically used to plot the nodes in positions that reflect their logical relations, or that simply permit a clearer view of the topology.
Toolbar
The following table describes the buttons in the toolbar on the left side of the screen:
| Icon | Description |
|---|---|
| Information section. Click to view the tool's help section. This is where the help tour can be activated. | |
| Control Window. Click to open or close the new tab where the Control Window is displayed. | |
| File system. Click to open the modal where all the designs are listed. In this modal you can choose the design you want to work with. | |
| Dashboards. Click to open a mode where you choose the type of dashboard you want to open in a new tab. | |
| Network Controller. Click to display the network controller section. | |
| Delta analysis. Launch the delta analysis over the current network design. Results will be accesible in different parts of the Control Window. | |
| Show downlayer traffic propagation. Shows the links in lower layers that carry traffic of the picked element. | |
| Show uplayer traffic propagation. Shows the links in upper layers that provide traffic traversing the picked element. | |
| Click to focus on the design with all its nodes and links. | |
| Node rendering algorithm. Runs an algorithm to order the nodes of a non-geographic layout based on their links. | |
| Collapse node aggregations Collapse all the elements within the same PoP. | |
| Expand node aggregations Expand all the elements within the same PoP. | |
| Snapshot Takes a snapshot of the current view. | |
| Link coloring. Displays links with their respective colors based on utilization value. | |
| Show node names Click to show or hide the node name. | |
| Show link utilization Click to show or hide the use of each link. | |
| Customization options Click to open the customization panel currently hidden. | |
Customization options for the view:
|
|
Click to show/hide the different types of links:
|
|
| Show/hide non-connected nodes. This toggle button allows to show or hide the nodes of the topology that have no links that are visible. |
Topology panel
Below is the Topology panel, where you can do the following:
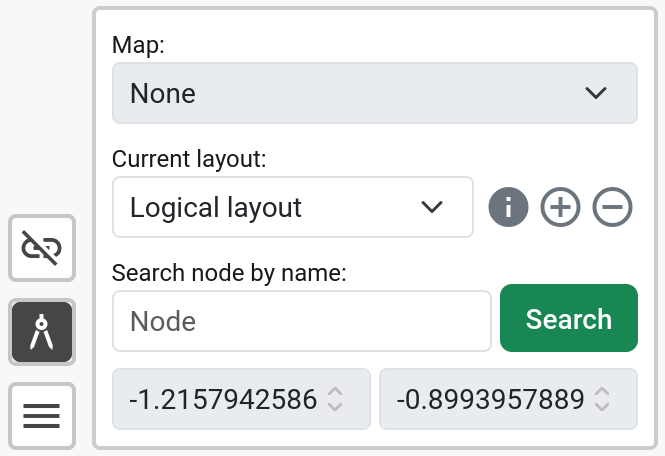
- Change map type, which are: openStreetMap; dark; none; or satellite.
- Change, view data, add or delete layout.
- Do a search by the name of a node.
- And display the longitude and latitude of where the mouse is at all times.
On the other hand, outside the panel, on the left side (between the toolbar and the panel), there are the following functionalities:
- Zoom in on the layout.
- Create a polygon and then be able to work with it through the layout.
Top menu
The following is shown in the top menu (starting from the left):
- On the left side the E-lighthouse logo is shown.
- In the center the name of the tool (E-lighthouse Network Planner) along with the name of the current design.
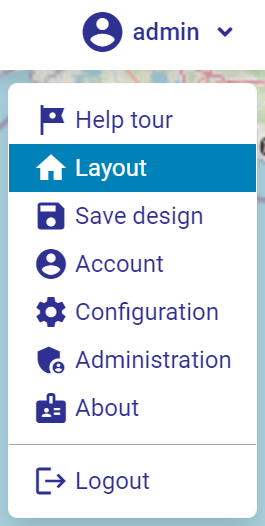
- And on the right side the submenu is displayed, where you can do the following:
- Run the help tour, where the sections of the screen and their main functions are explained to the user.
- Go to Layout.
- Save changes made to the current design to the database.
- Go to the Configuration section.
- Go to the Administration section, a section that is enabled if you are an admin user.
- Go to personal profile.
- And log out.
Key shortcuts
The following actions can be performed onto the active layout on the canvas:
- Control window. To open this section, you can select the layout button or click on the C key and then on the W key (C + W).
- Historial of the picked elements. After picking multiple items, you can undo or redo your changes as follows: press Alt + Left Arrow to undo; and Alt + Right Arrow to redo.