Control window
This window is designed to provide users with the ability to access detailed information, make network modifications, and generate reports for various tasks. Its primary function is to enable users to observe and adjust the network's status in a detailed and customizable manner.
The interface is organized into folders, each grouping a related set of tools. These tools are categorized to ensure easy accessibility while minimizing the number of graphical elements, helping users maintain focus on their tasks. The overall design emphasizes simplicity and efficiency, allowing users to navigate and perform operations with ease.
Organization
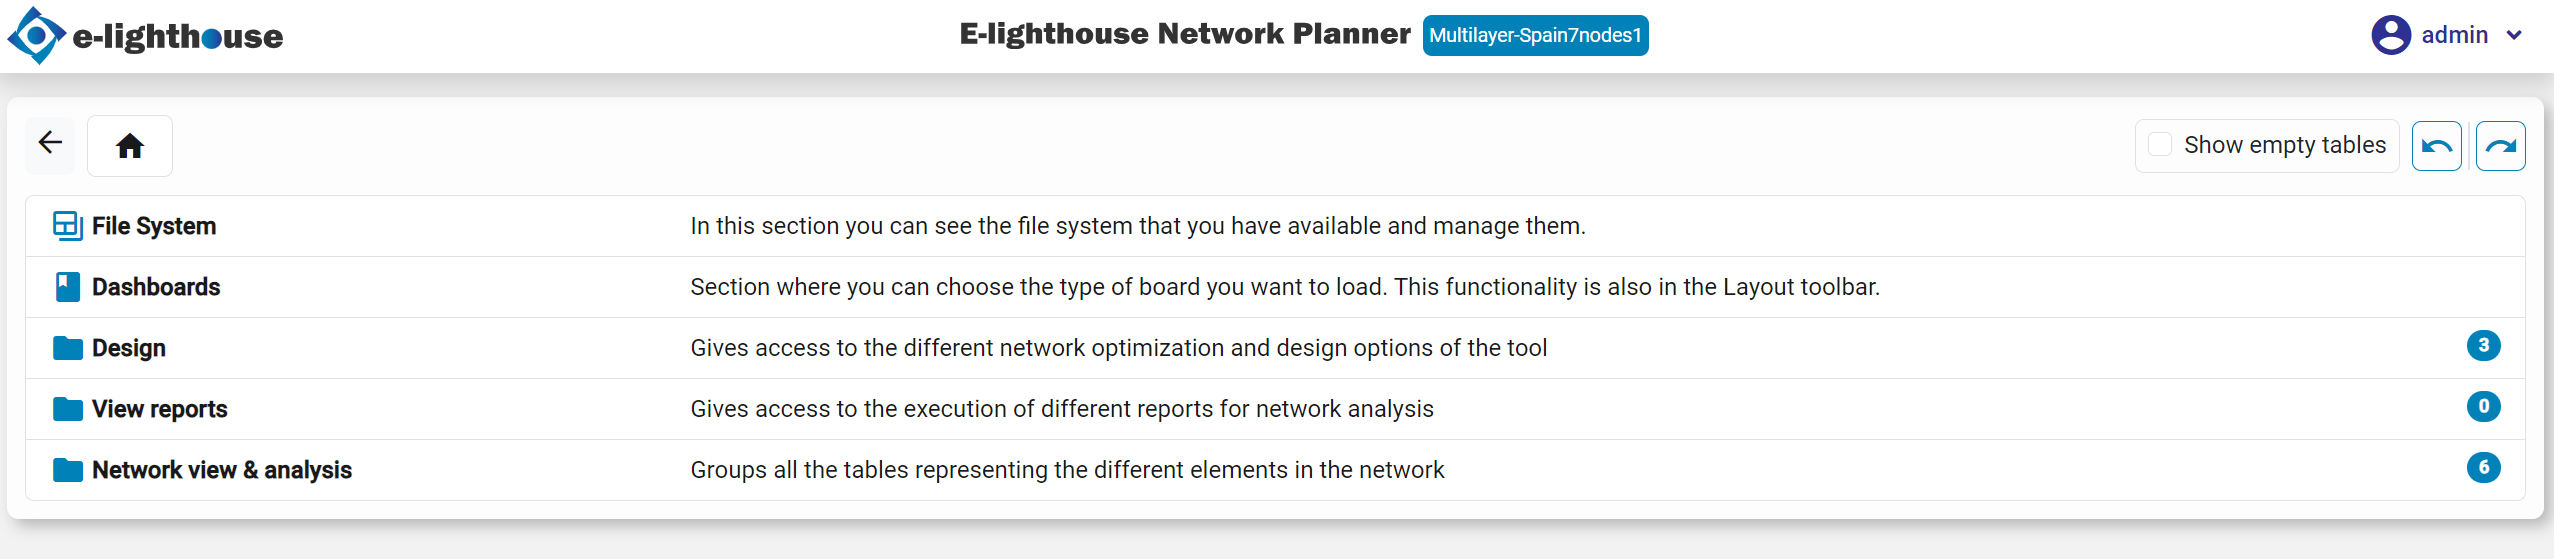
As observed in the image, the control window is organized into the following sections:
File System
This section allows you to manage stored designs and folders. You can create, delete, clone, download, upload, and move designs within the file system. The permissions are set similarly to a Unix-like system, meaning you will only see folders and designs that you have access to.
View Reports/Dashboards
This section stores the available reports and dashboards related to the network. Each report or dashboard focuses on a specific theme, providing detailed summaries and insights into various aspects of the network.
Design
In this section, you will find several tools for building network designs from scratch. These tools include the allocation of links, capacities, OTUs, and other elements, along with the definition of 'Design Rules.' The section also offers algorithms to provision different network layers. Additionally, there is a tool for executing algorithms in batch processes and offline mode, allowing you to run time-consuming algorithms in the background and access the results later.
Network View & Analysis
This section contains tables that display the information and status of the network. It is organized into categories, each focused on a specific network layer (e.g., IP, Optical), making it easy to find the desired information. Most subcategories include a list of tables for each network element, enabling detailed analysis and tuning of the network.
Monitoring & Forecast
This section provides tools for monitoring network usage and forecasting future trends. These tools offer insights into the long-term sustainability of the network and design, helping you plan for future needs.
In the upcoming subpages, each section is better described and contains more in-depth details to properly use the network to design the network and retrieve the insights.
Table view
Tables are a key point of the tool, as them show detailed information about the state of the network, and in most cases, them allow to directly modify the value of some static input-like values.
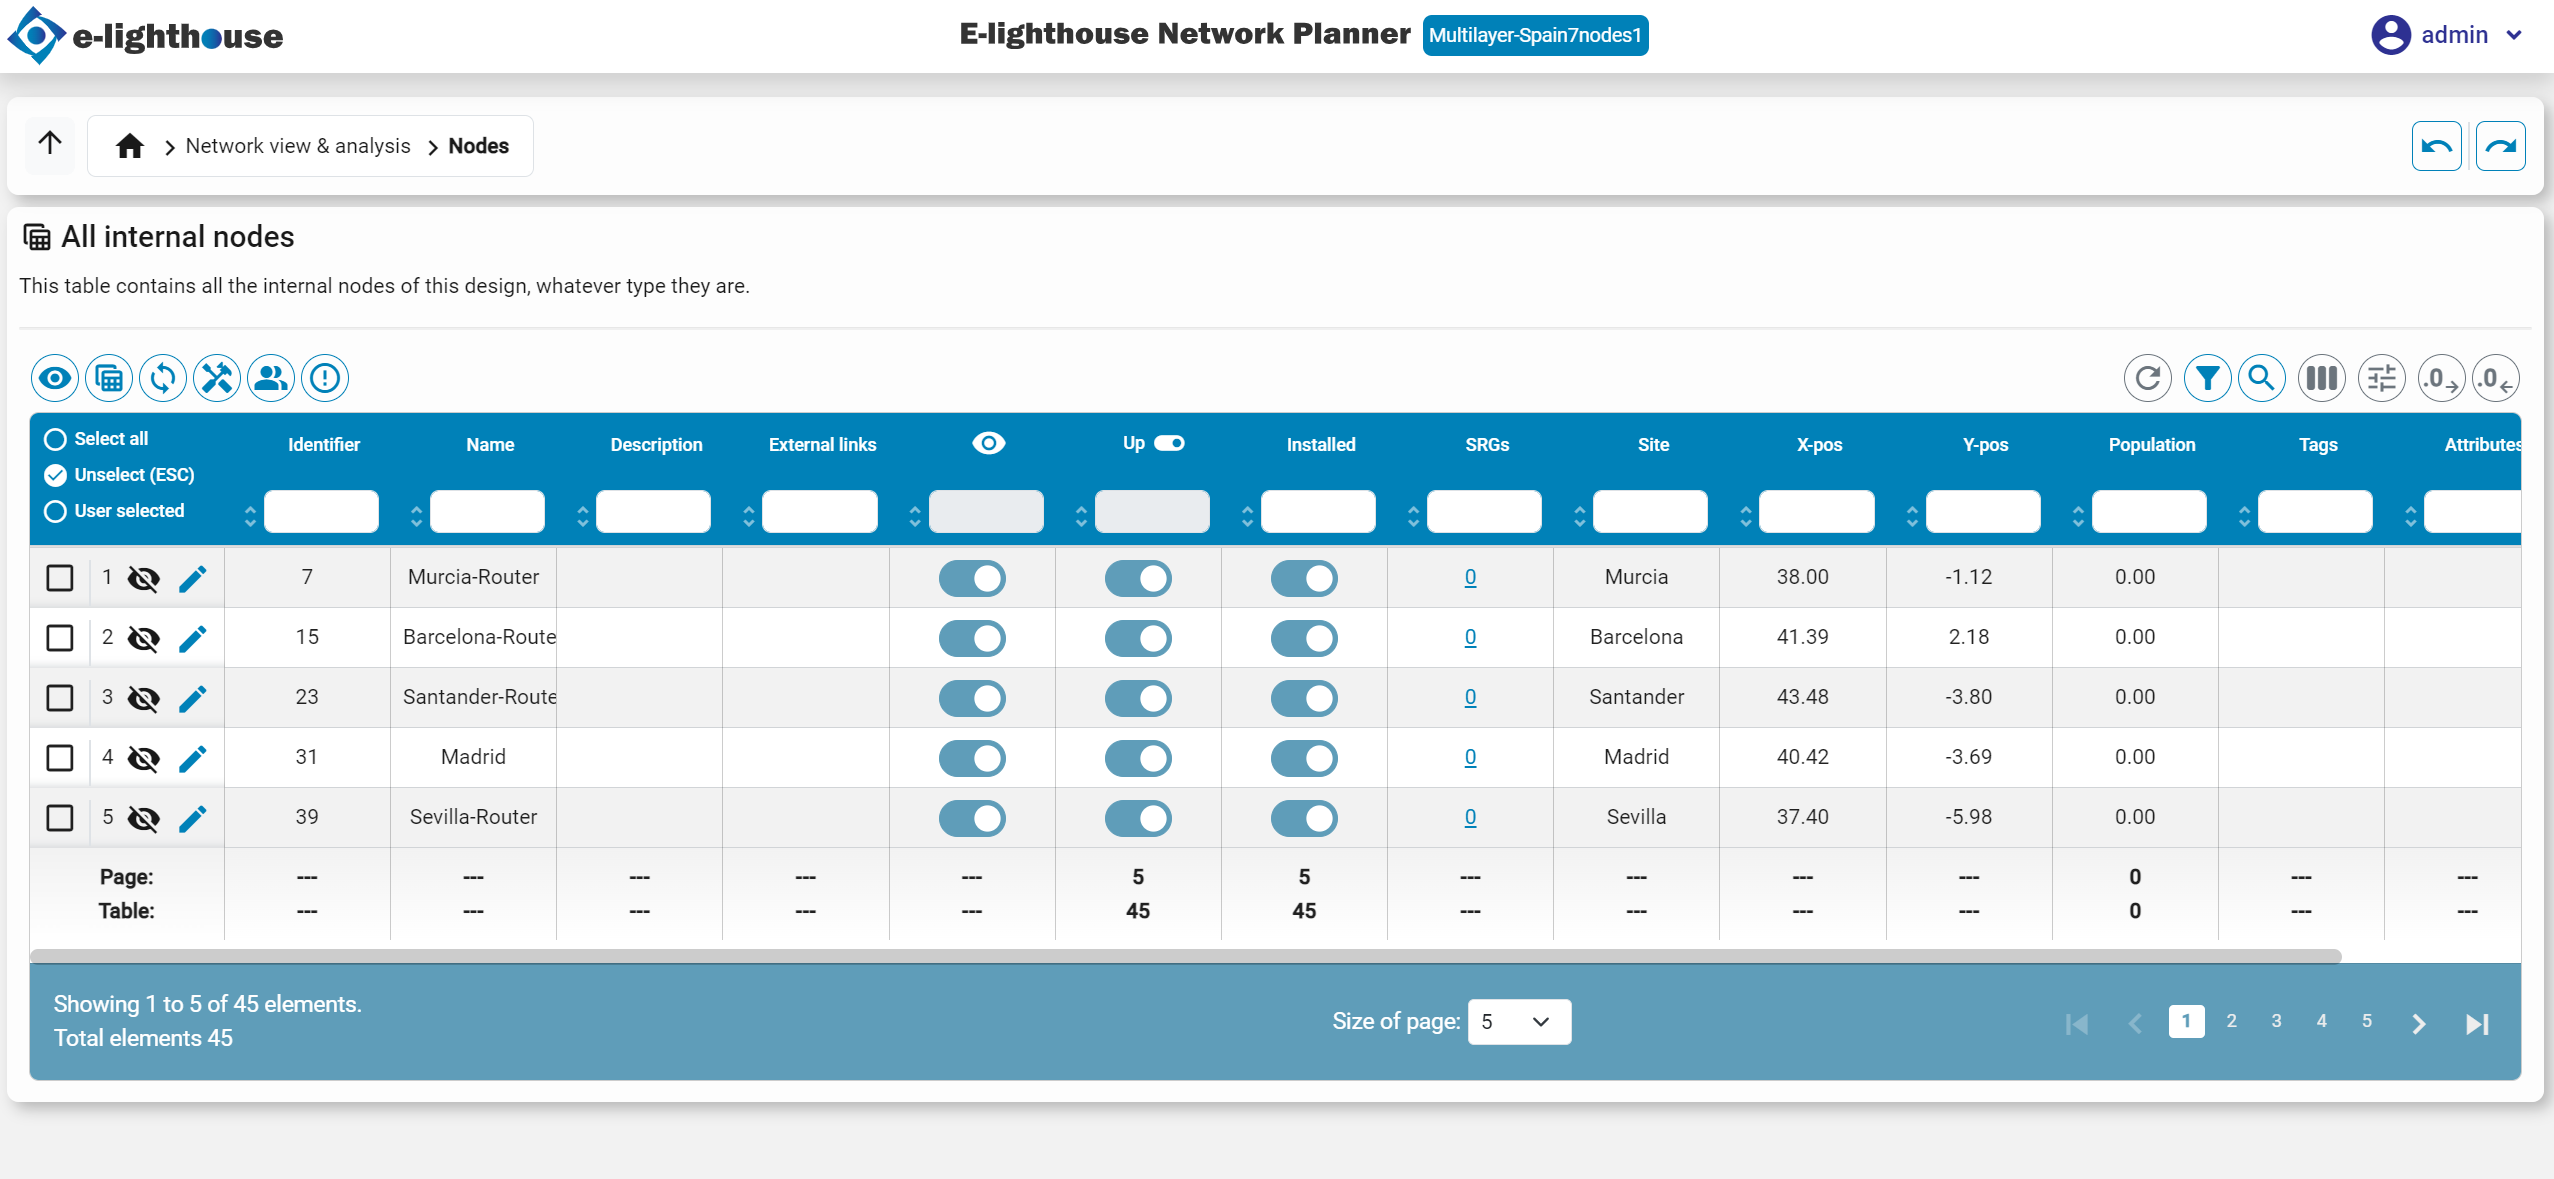
Table components & features
Each table is comprised on the sections/features, which enable the user to customize the information shown on the table, and thus, adjust the table to work with the precise and required information.
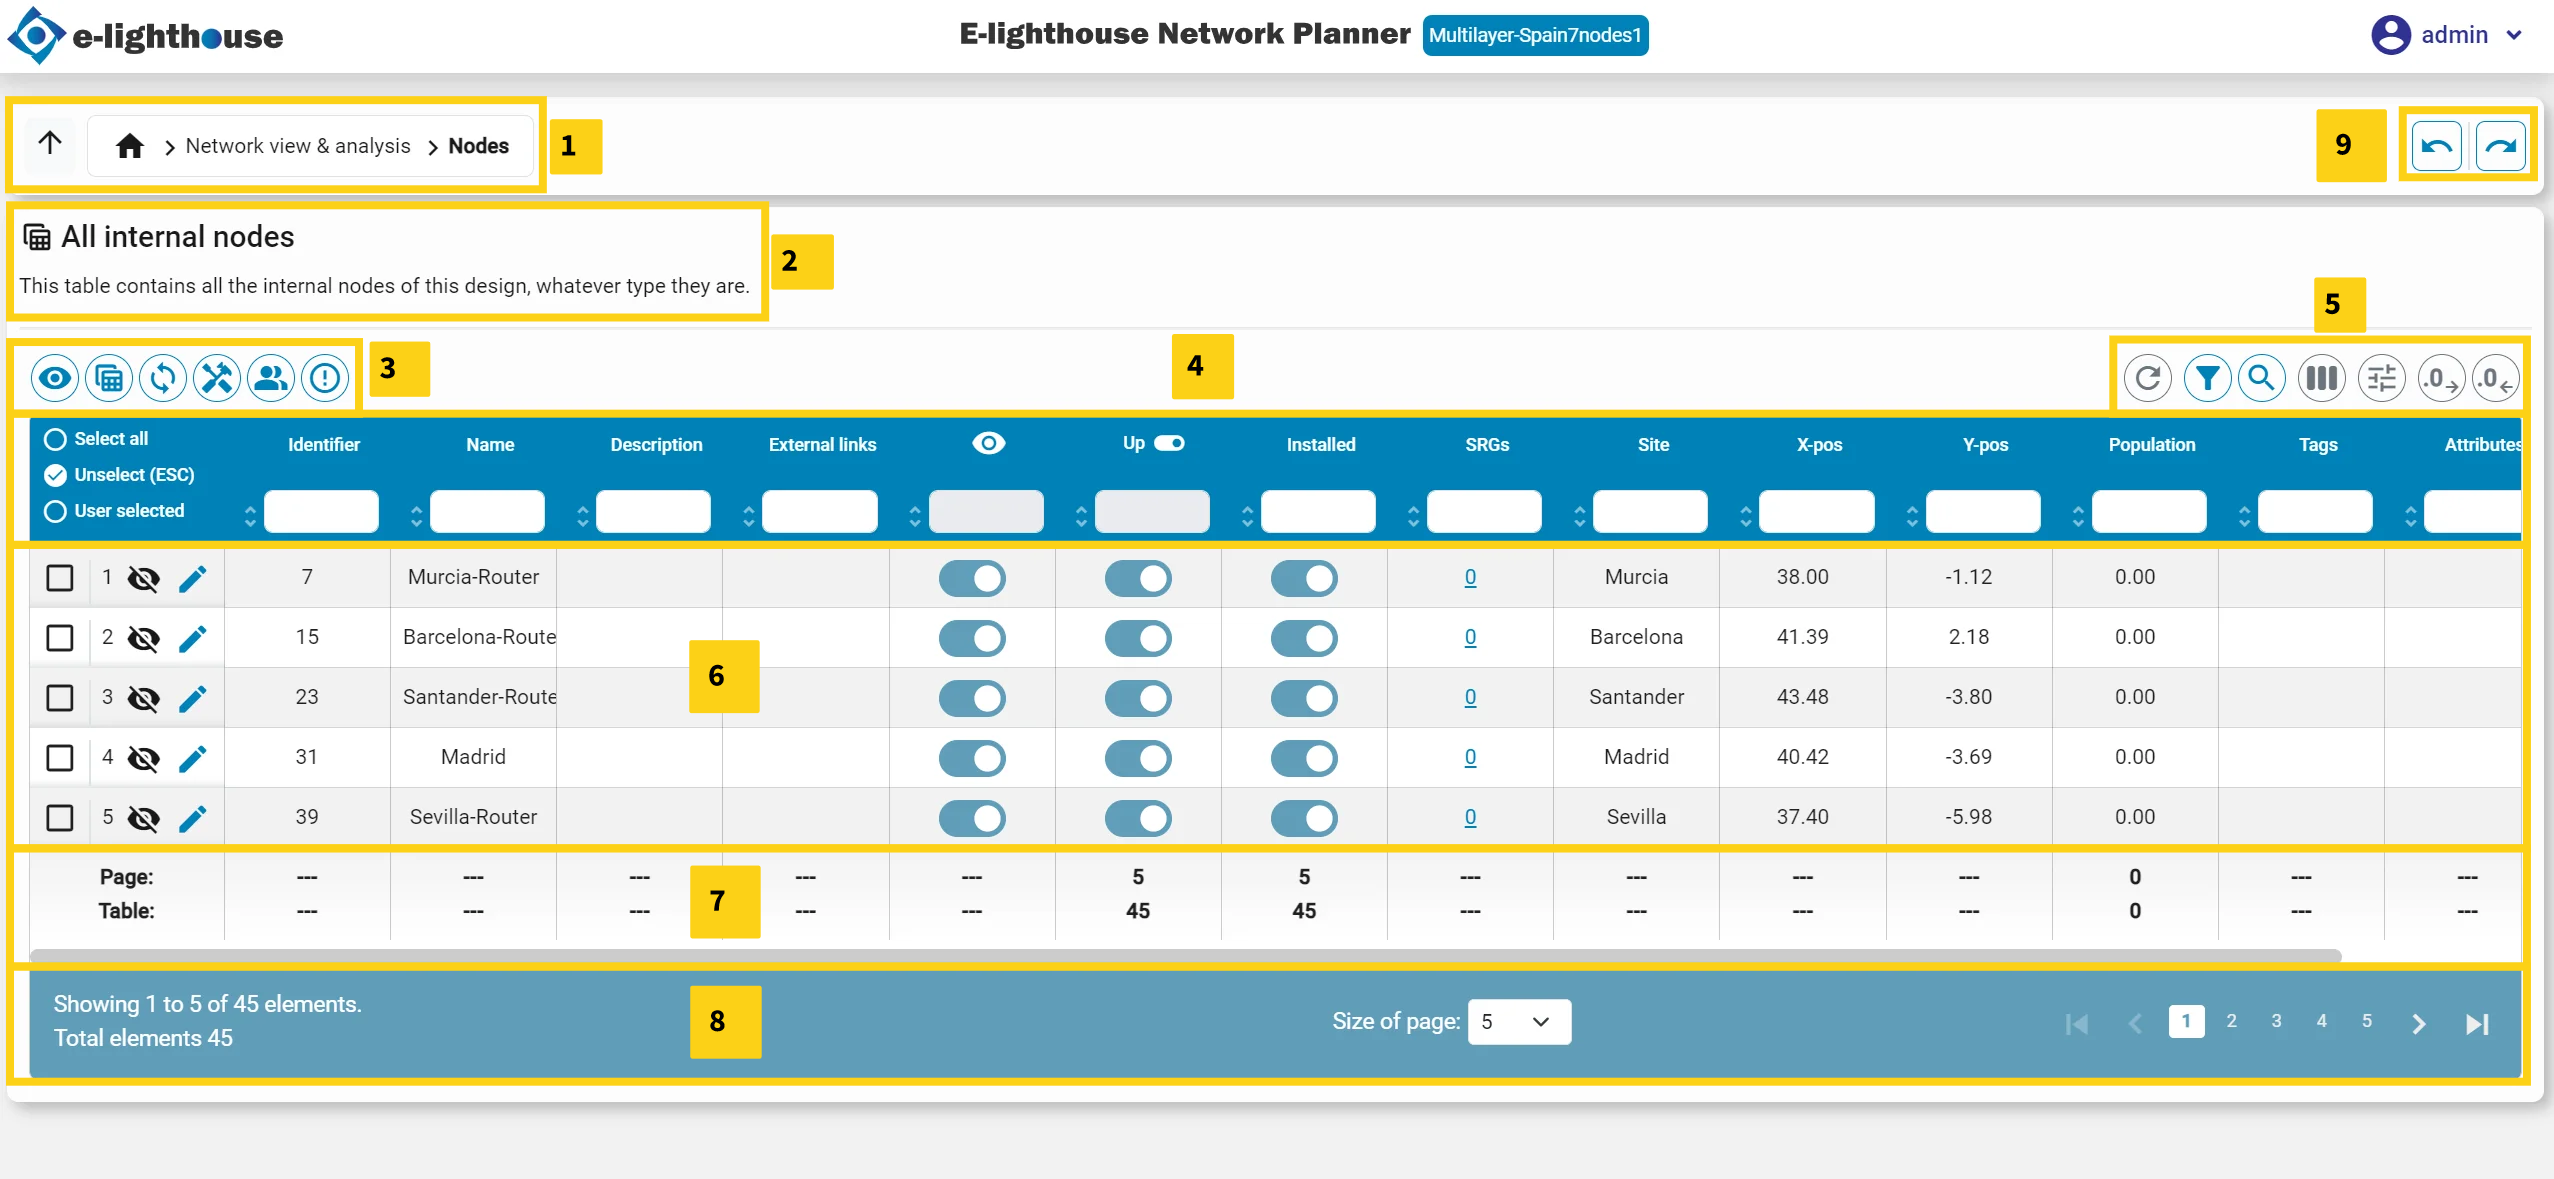
- Parent folder: folder in which the table is stored, allowing to be clicked and move to upper categories/leaves of the Control Window.
- Name & description: name and description of the viewing table.
- Columns pre-set: preset views for the table. Each one, including a tooltip with the description, allow the user to view the table in a goal-to way so the information shown is relevant to a task. Each table, and so each model, has its own list of pre-set groups.
- Viewing columns & filters: the headers of the table, and thus the columns, currently being shown. Those are changed dynamically as the user modifies the view of the table. For each column, it is contained a small input form to include some Filters.
-
Table configuration: configuration of the table, including:
- Reload table information.
- Clean all the filters.
- Fuzzy search.
- Visible columns. Allows to toggle each single column available for the table.
- Aggregators columns. Allows to modify the aggregation function of each column, by selecting it at the bottom of the column.
- Increase & decrease number of decimals.
- Export to excel. Export the current view of the table into an Excel sheet.
-
Table content: the content of the table itself. It shows the values of each column and also allows to
pick,hide/showandeditrows of the table. It also contains aright-click menuto add/remove/modify content of the table in single/batch way. - Column aggregators: aggregation view for each column, as configured in the table or by the default aggregations.
- Table navigation: allows to define the amount of entries to show, as well as to move from pages.
- Table to table navigation: allows to navigate to previous/forward tables, in the case that the table shown is the result of redirection from another table.
Cell types
Each cell can contain one of the following types of values:
- Text
- Number
- Boolean
- JSON: Clicking on these values opens a pop-up window, allowing easy viewing of the JSON content.
- Text List
- List of Elements: These values include a list of items from other tables within the tool. Clicking on them redirects to the relevant table and automatically selects the associated elements.
- Optional: can contain other types of values or either none.
Filters
Each column can receive a filter to only show the rows matching the criteria. As the previously mentioned values that cell can have, each type of cell can be filtered in a different way:
- Text: starts with the given text
- Number:
> < == != >= <= - List of Elements:
#> #< #== #!= #>= #<= - Optional:
> < == != >= <= #empty #present
Key shortcuts
- Alt + S: to show empty tables too.
- Alt + F: to show the data-Containing too.
- ESC: escape key to deselect the rows of the tables.
- Historial of the picked elements. After picking multiple items, you can undo or redo your changes as follows: press Alt + Left Arrow to undo; and Alt + Right Arrow to redo. History of selected items: After selecting multiple items, you can undo or redo the changes as follows: Press Alt + Left Arrow to undo; and Alt + Right Arrow to redo. You can also do this thanks to the following buttons: