Network visualization, analysis & design GUI
ENP's smart multilayer visualization offers both geographical and logical user-defined views of the network topology. Through its intuitive Graphical User Interface (GUI), users can seamlessly access a variety of network performance metrics, gain visual insights into multilayer interactions, and utilize additional tool functionalities, all of which will be demonstrated in this section.
ENP tool has two main windows, as illustrated in the next Figure:
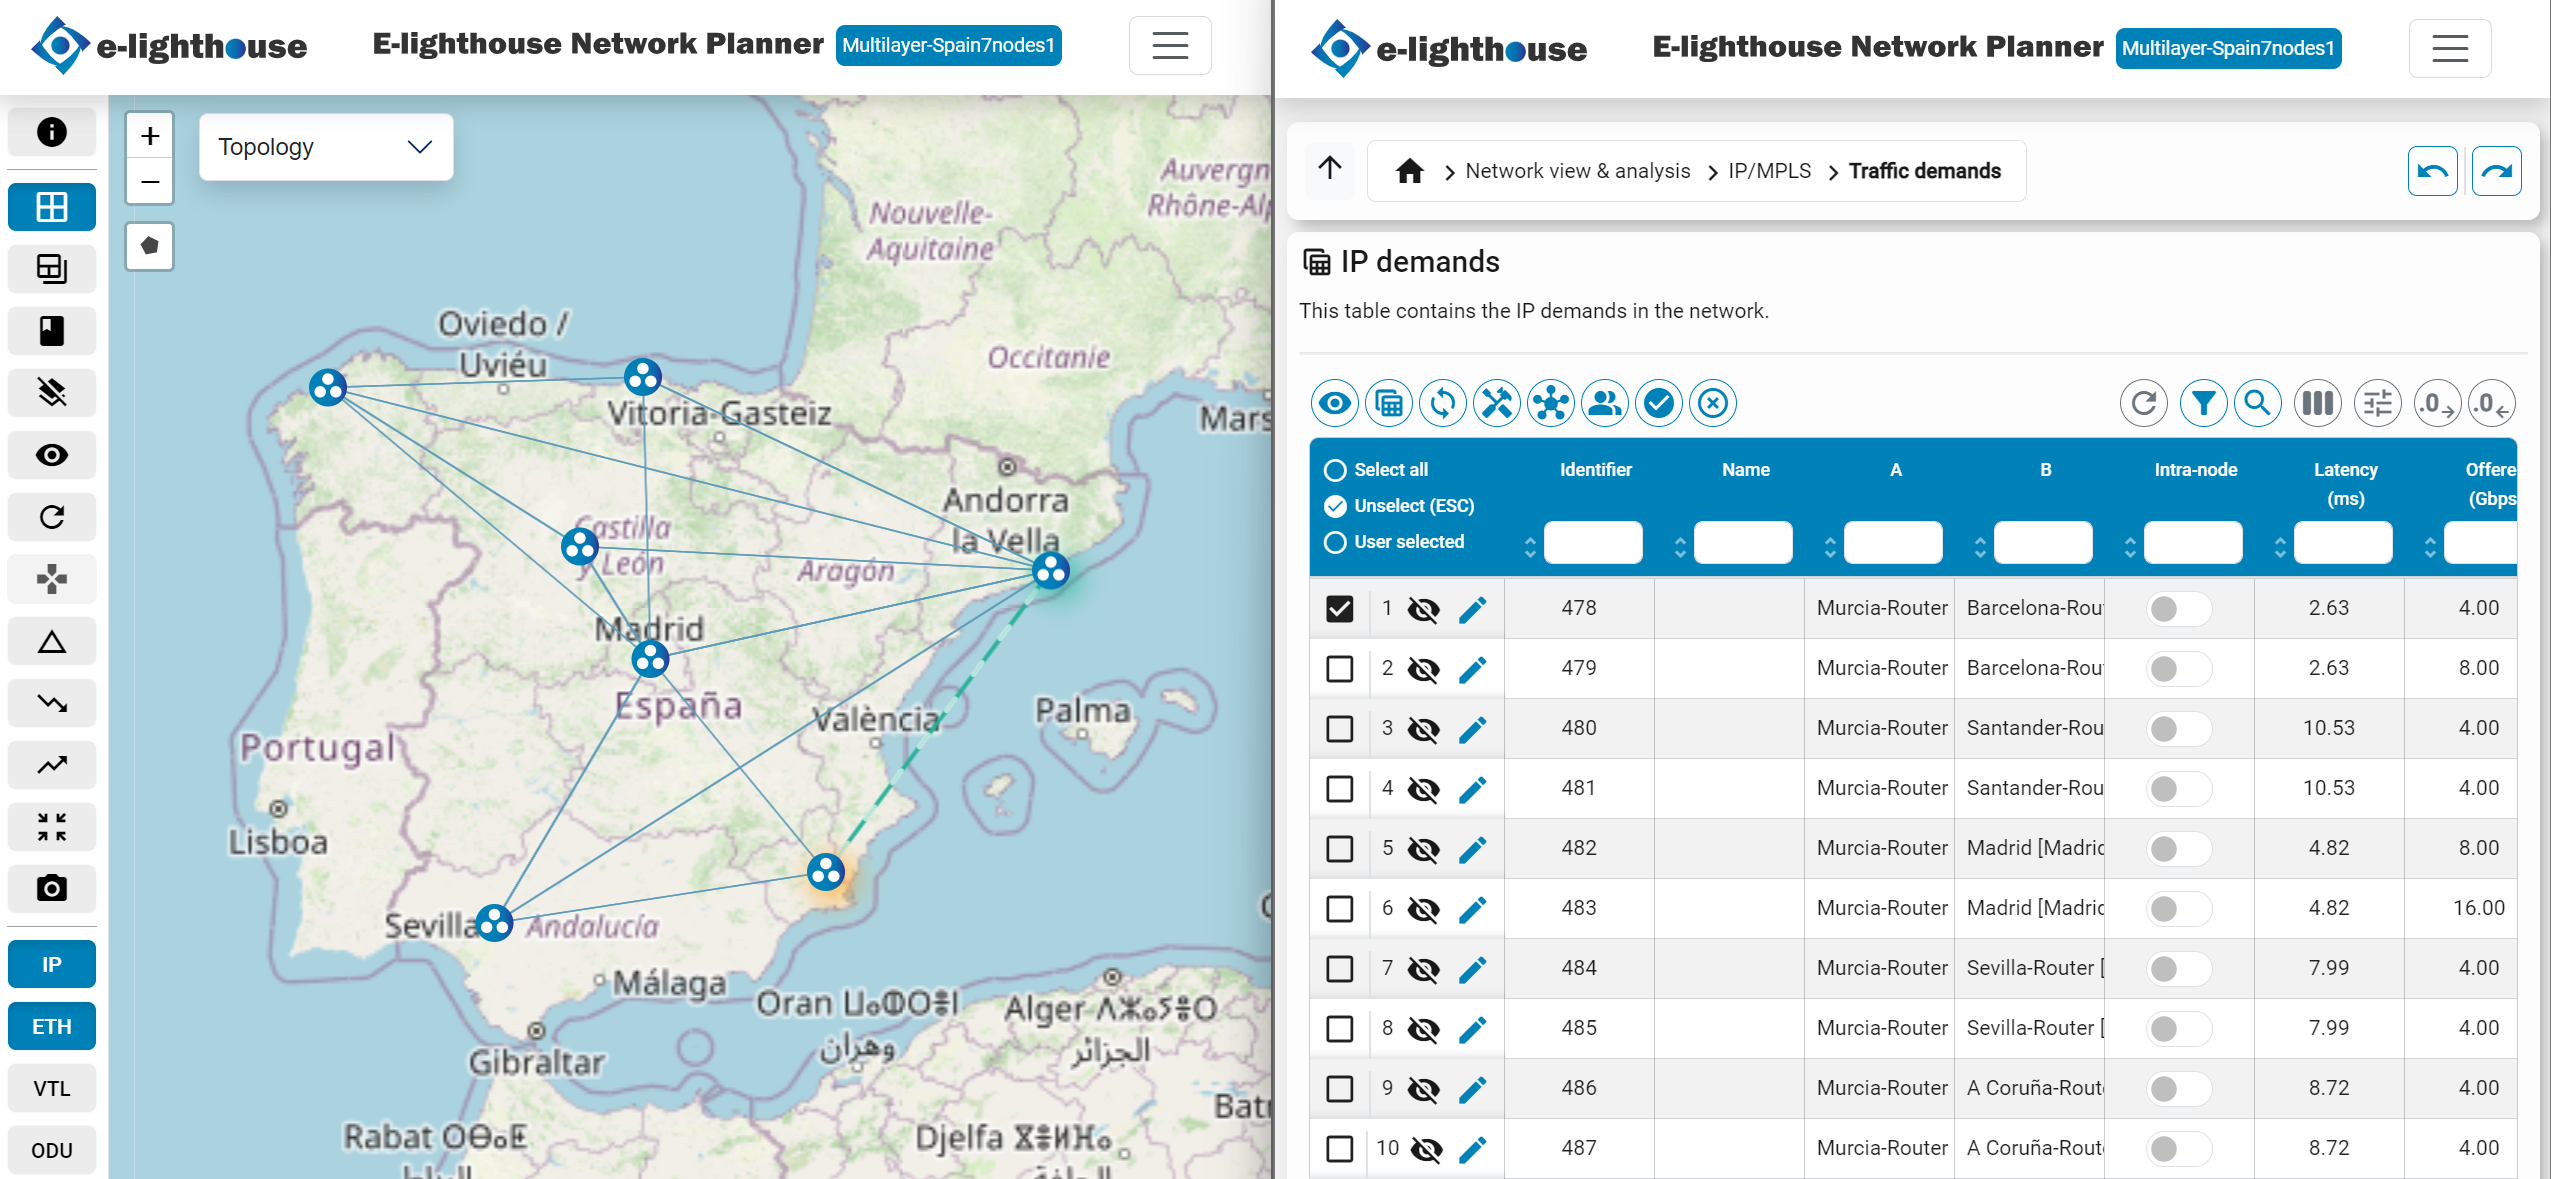
- Topology window. Displays the network topology on a canvas, enabling users to manipulate the network representation in various formats and access additional functionalities through intuitive buttons.
- Control window. Hosts tables, dashboards, and report panels for network manipulation, viewing, and analysis, while offering access to network design and reporting functionalities.