Exploring the User Interface
Once logged in, you’ll enter the main ENP interface — the control center for designing, simulating, and analyzing network topologies. This guided tour will walk you through the most important parts of the application interface.
Use the links below to jump to a specific section of the tour:
🧱 Tour in Topology View
👀 Want to dive deeper?
Topology View →
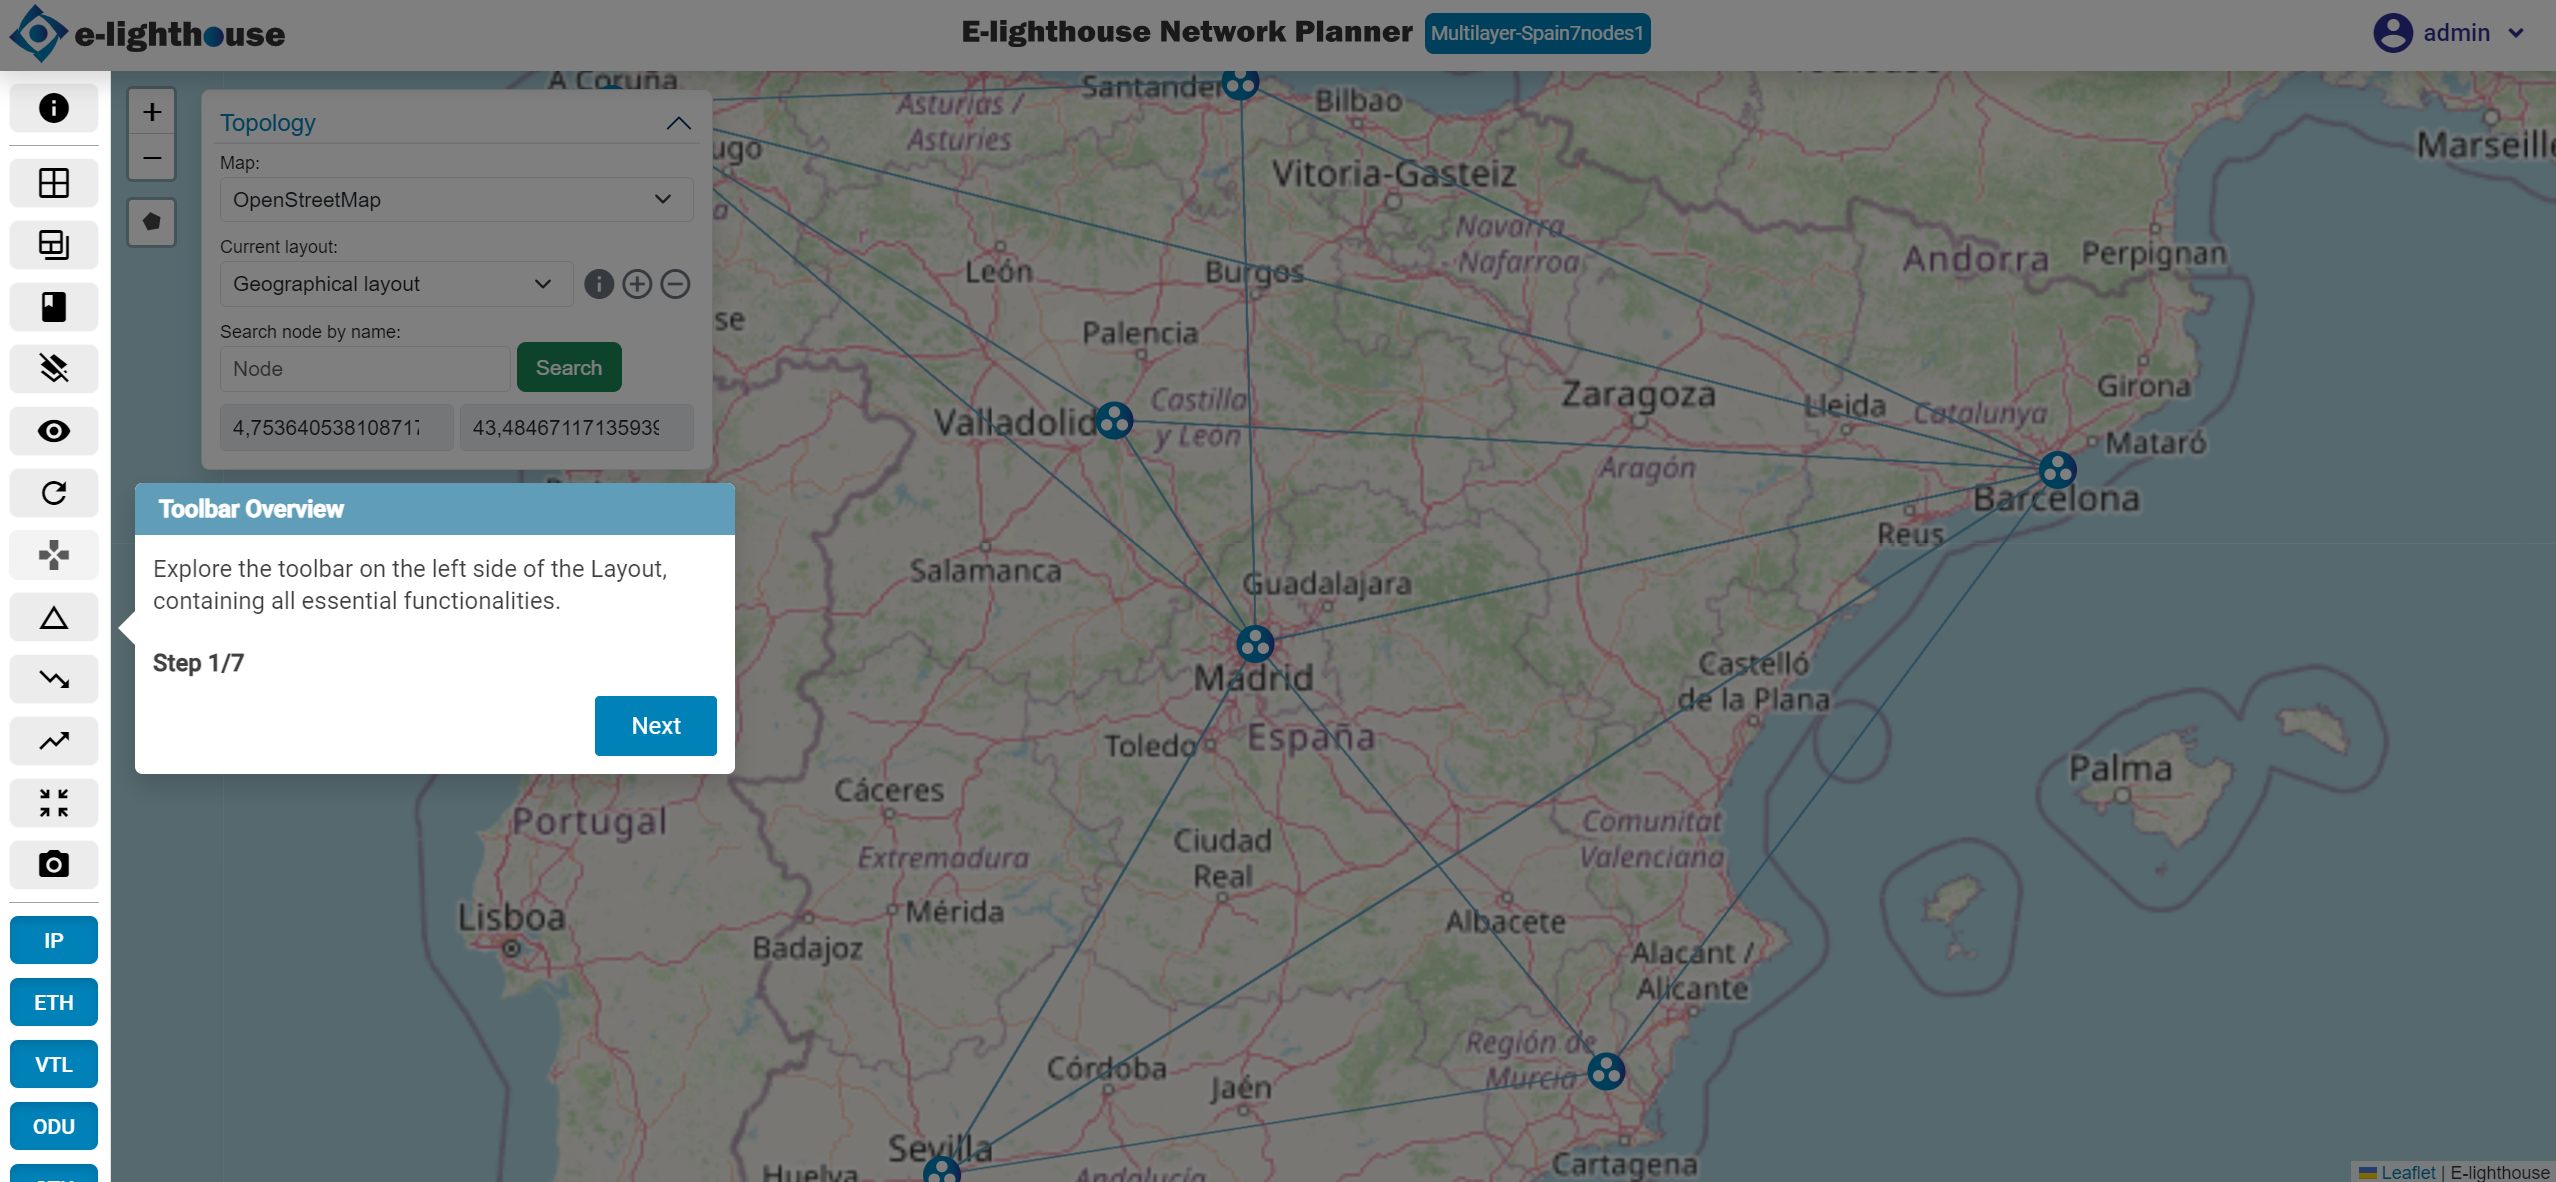
Step 1 of 7: Toolbar Overview
Explore the vertical toolbar on the left side of the screen. It provides quick access to core functionalities such as adding nodes, running simulations, and visual tools.
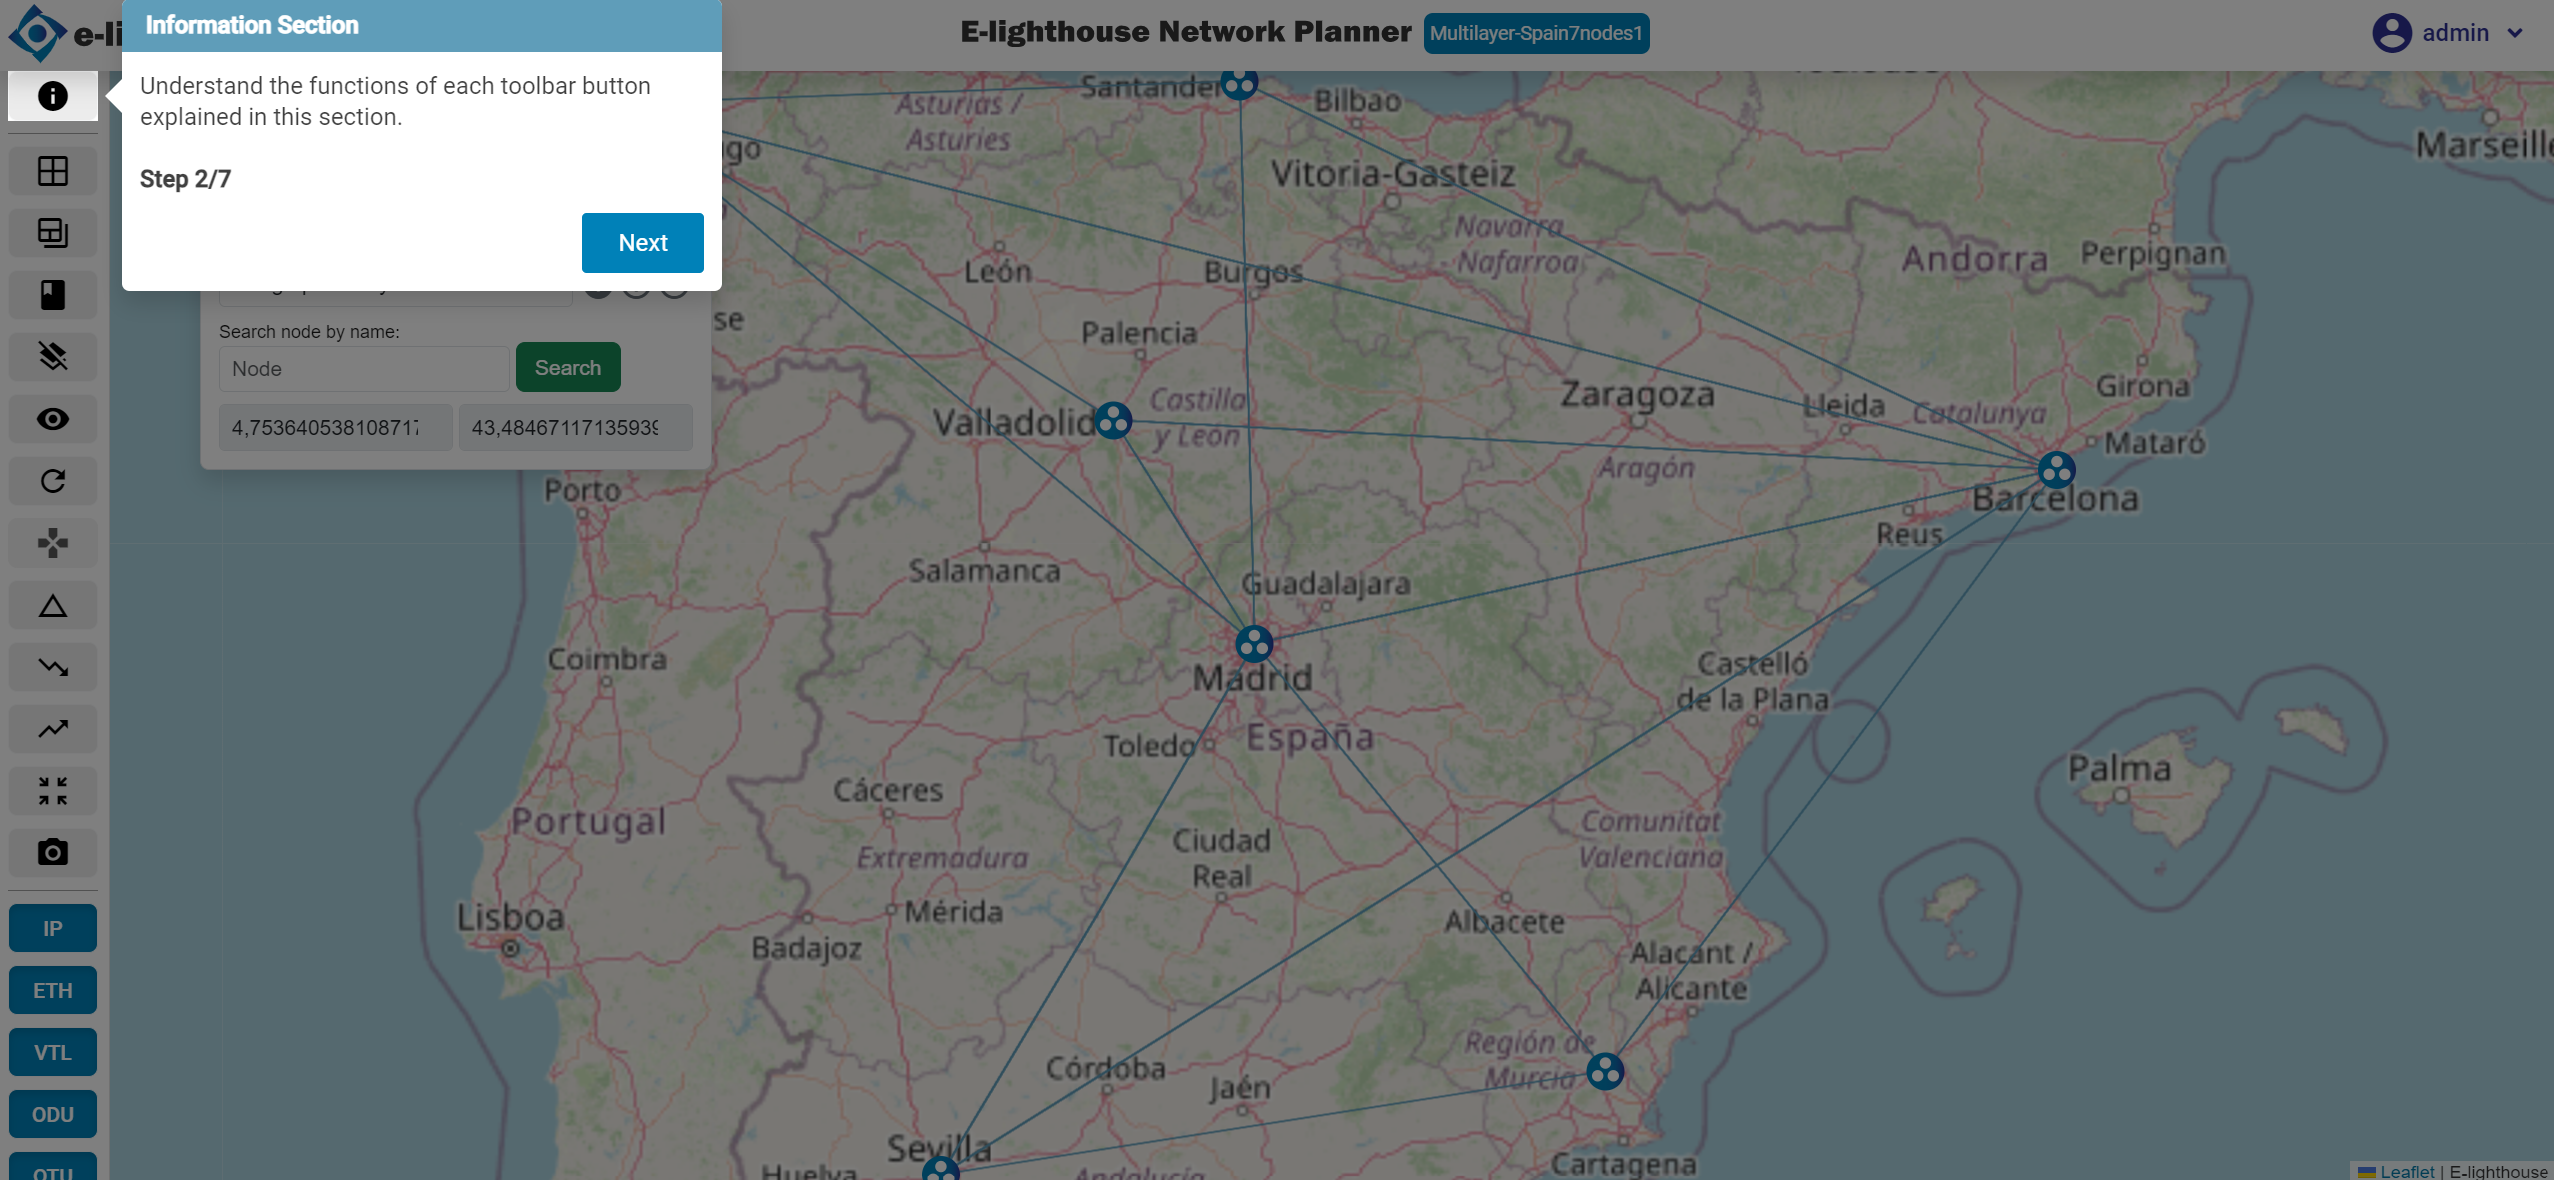
Step 2 of 7: Information Section
Hover over each toolbar button to view tooltips describing their purpose and behavior.
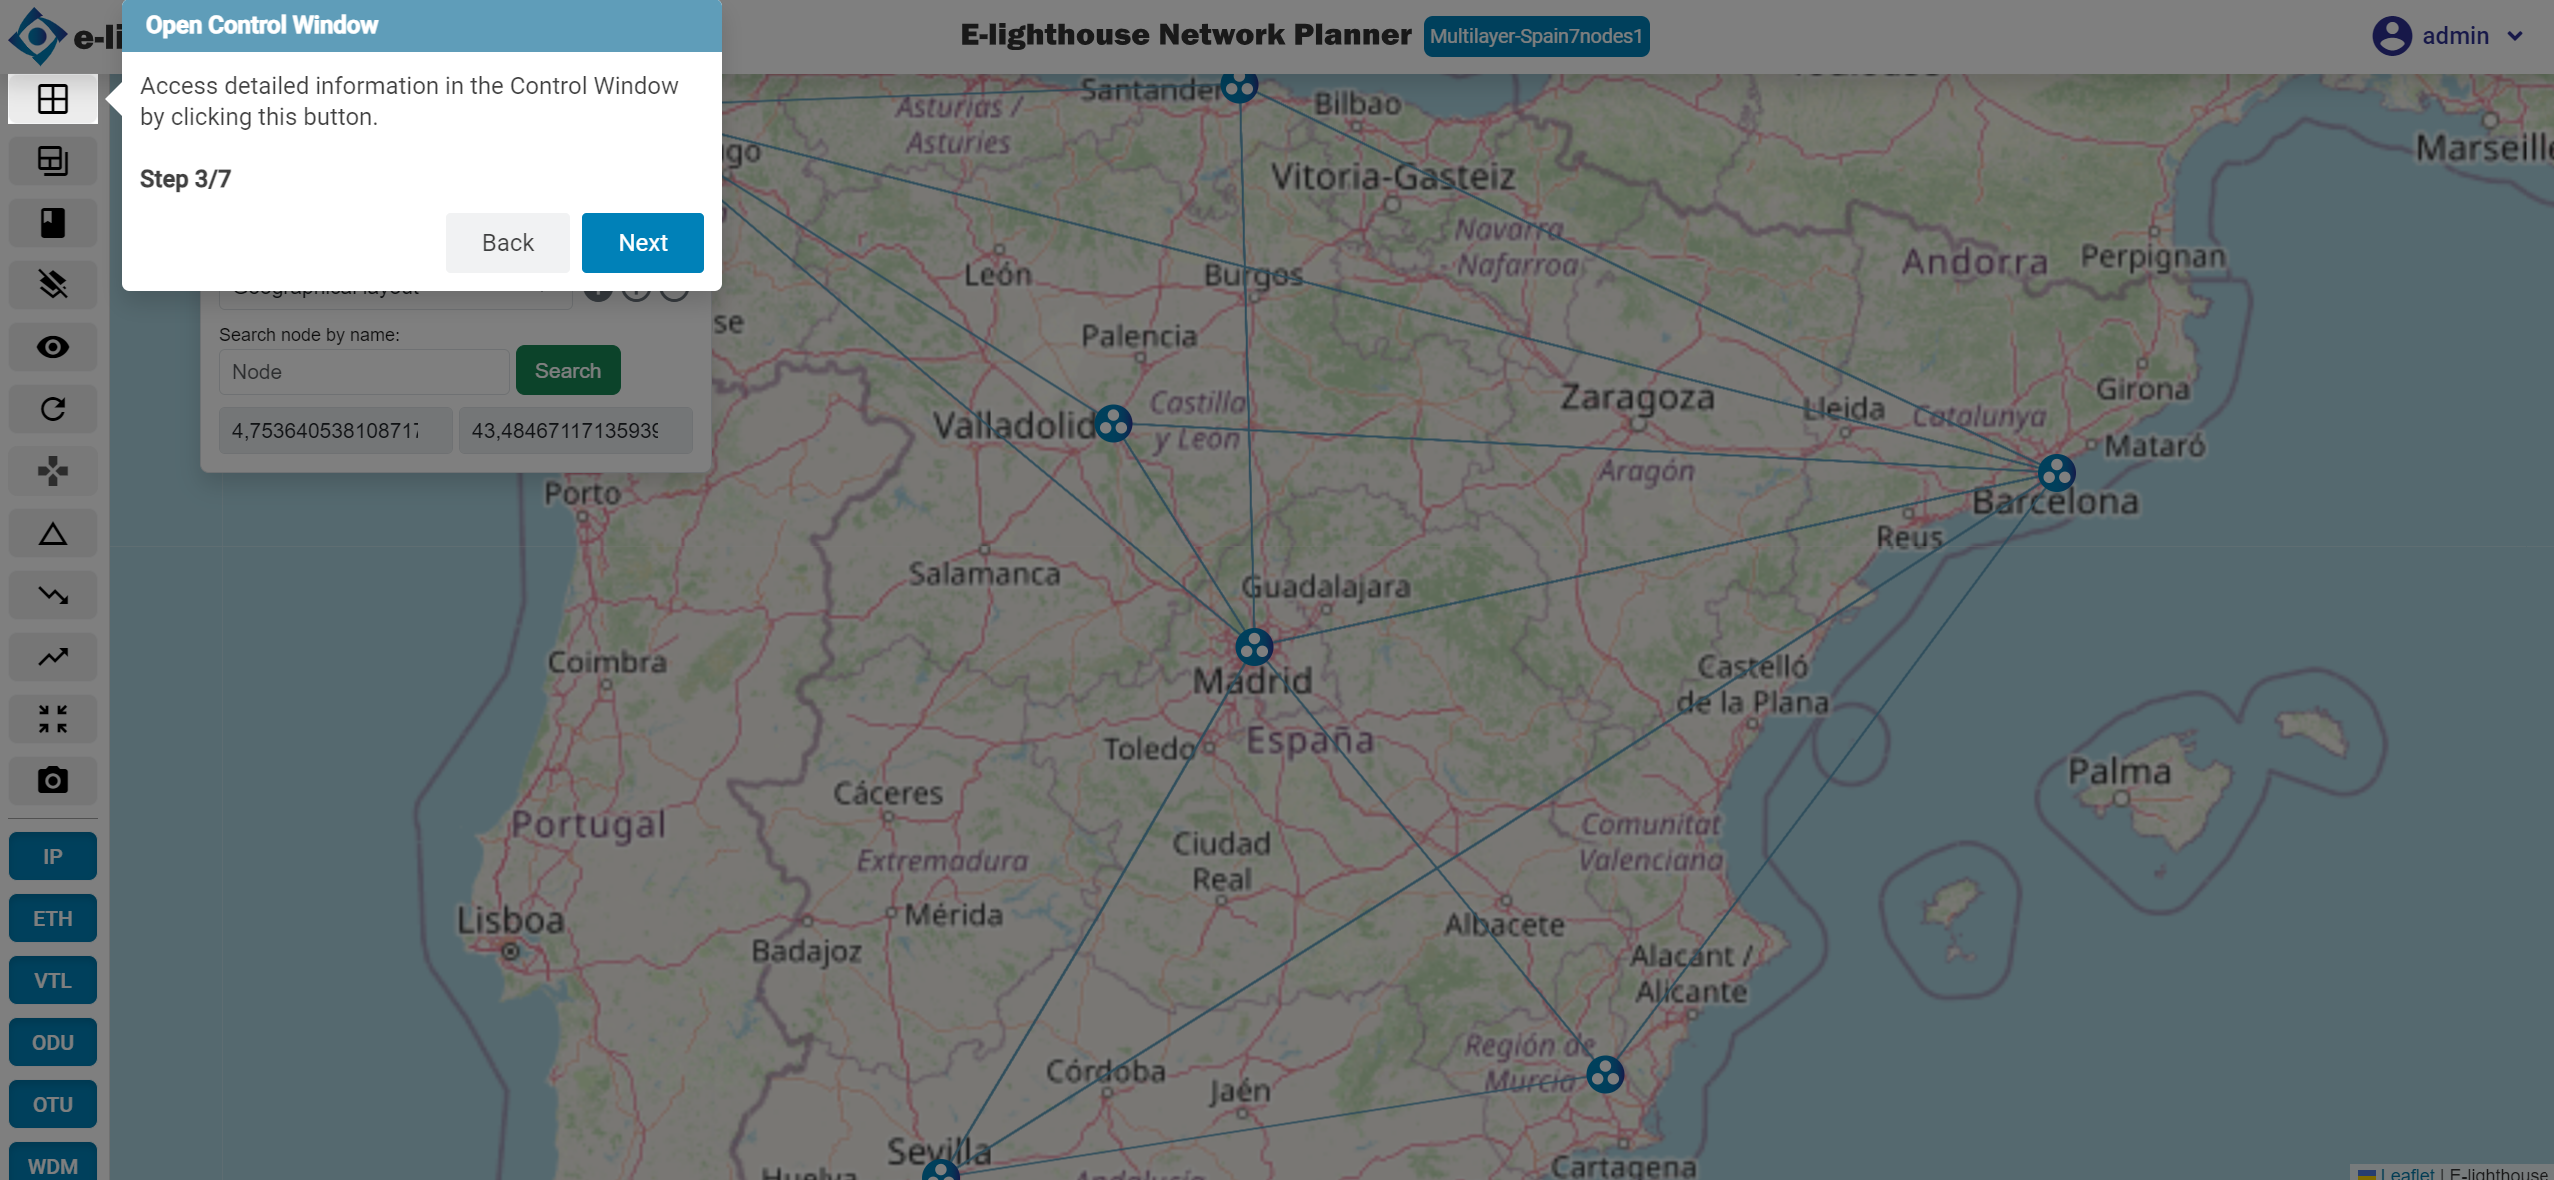
Step 3 of 7: Open Control Window
Click this button to open the Control Window for detailed element editing, configuration, and inspection.
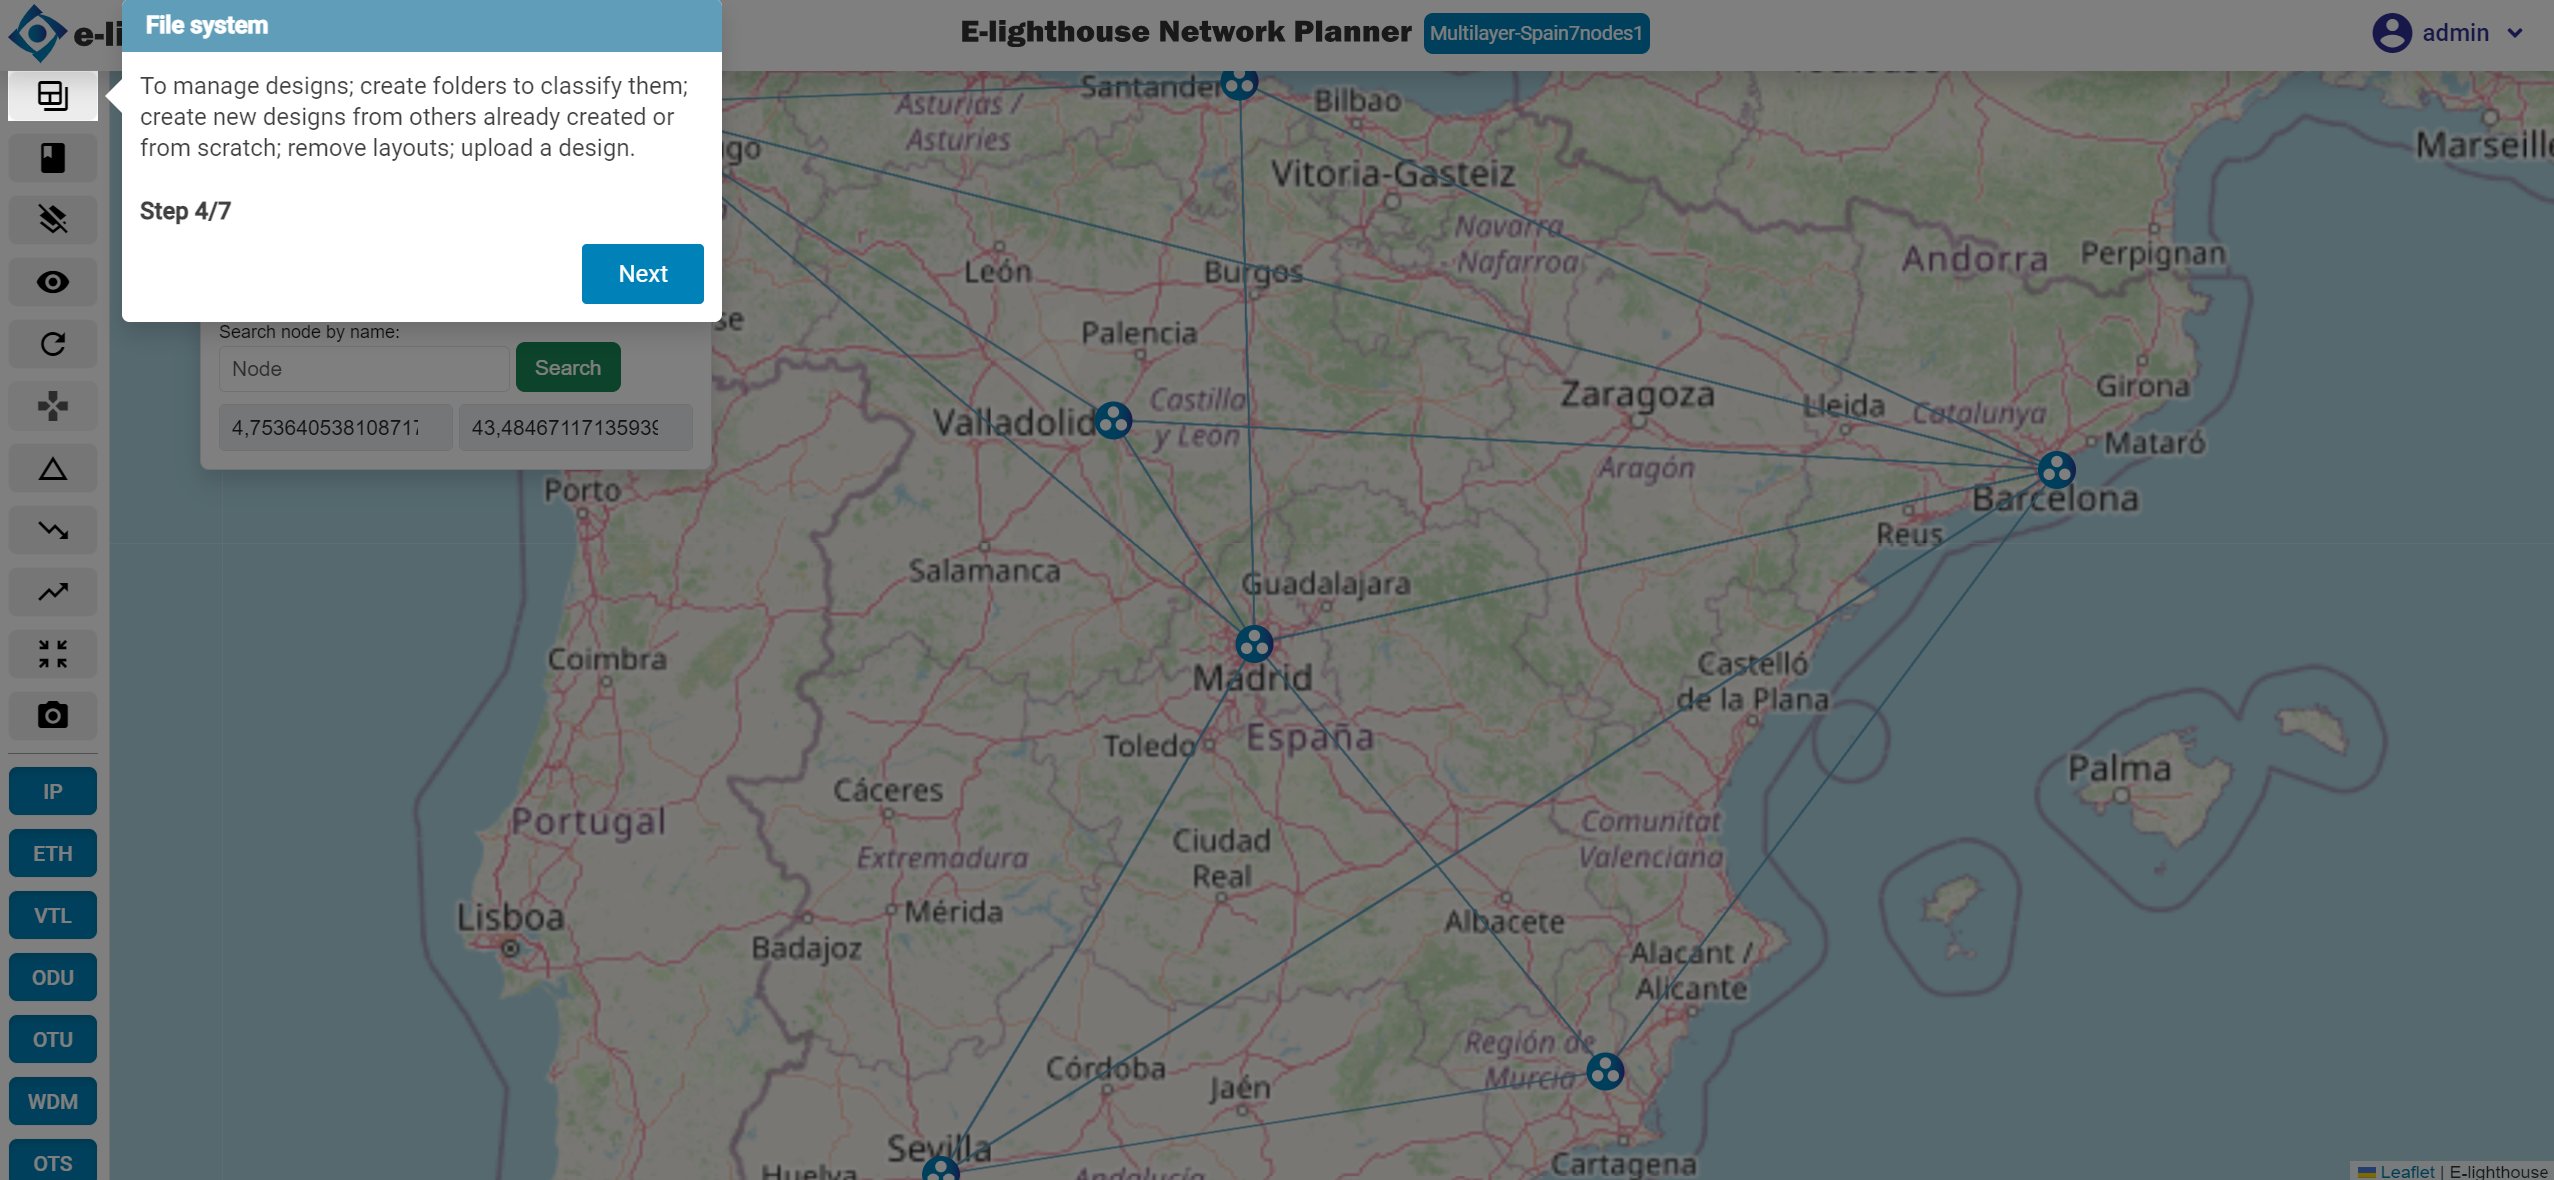
Step 4 of 7: File System
Manage your network designs: create folders, duplicate or delete designs, and upload files.
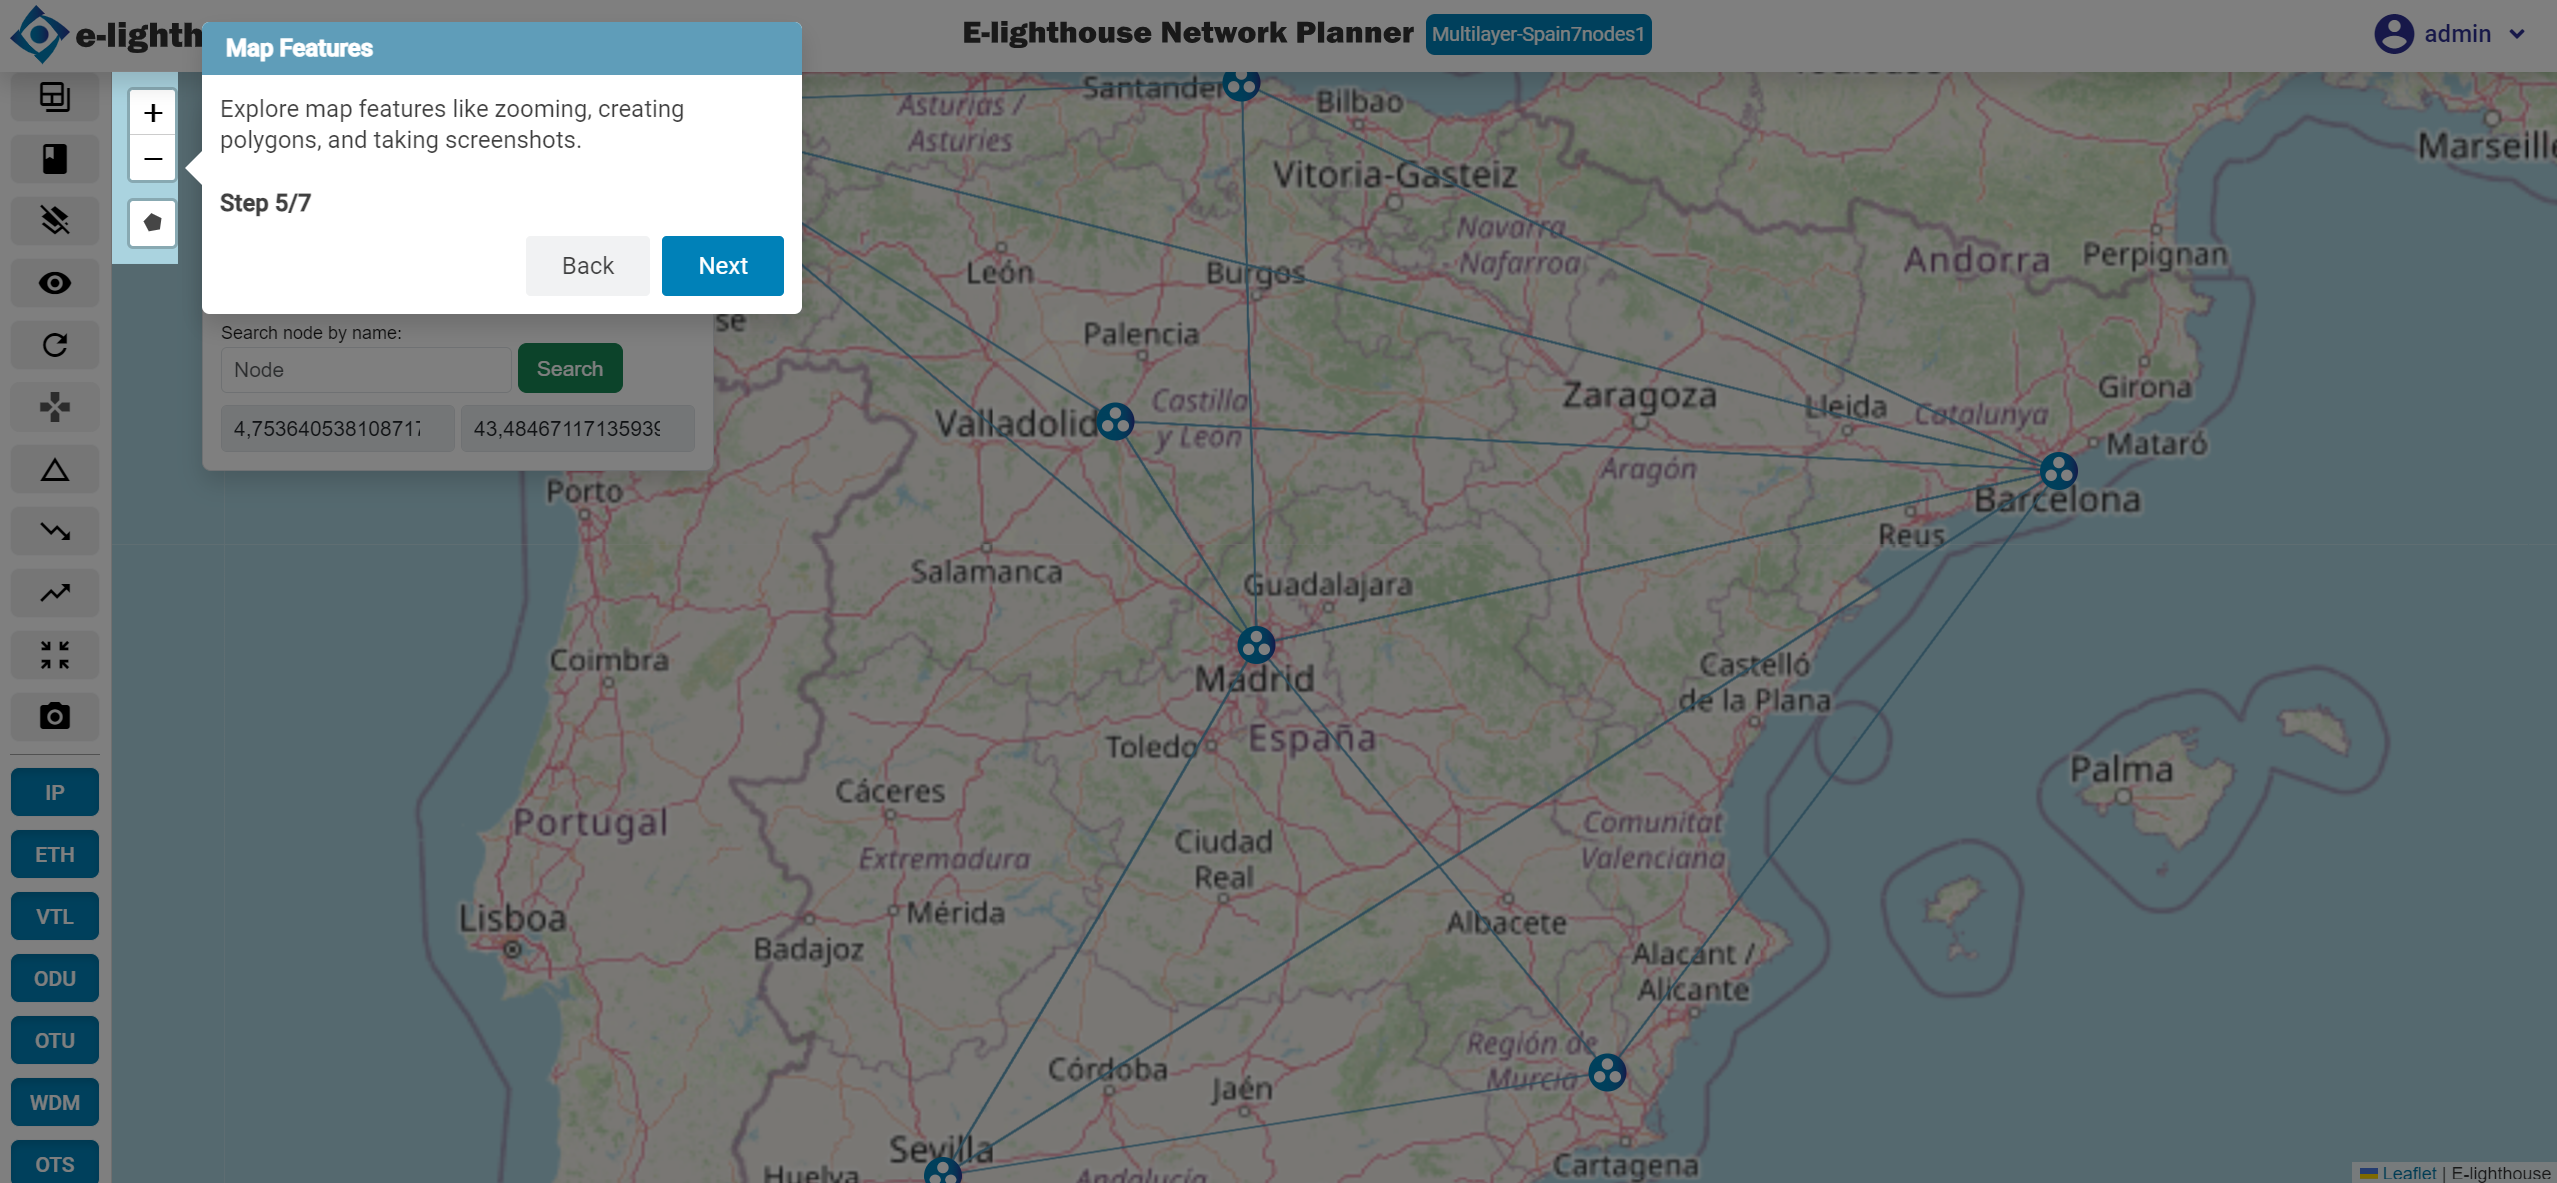
Step 5 of 7: Map Features
Use the map tools to zoom, draw polygons, measure distances, and take screenshots.
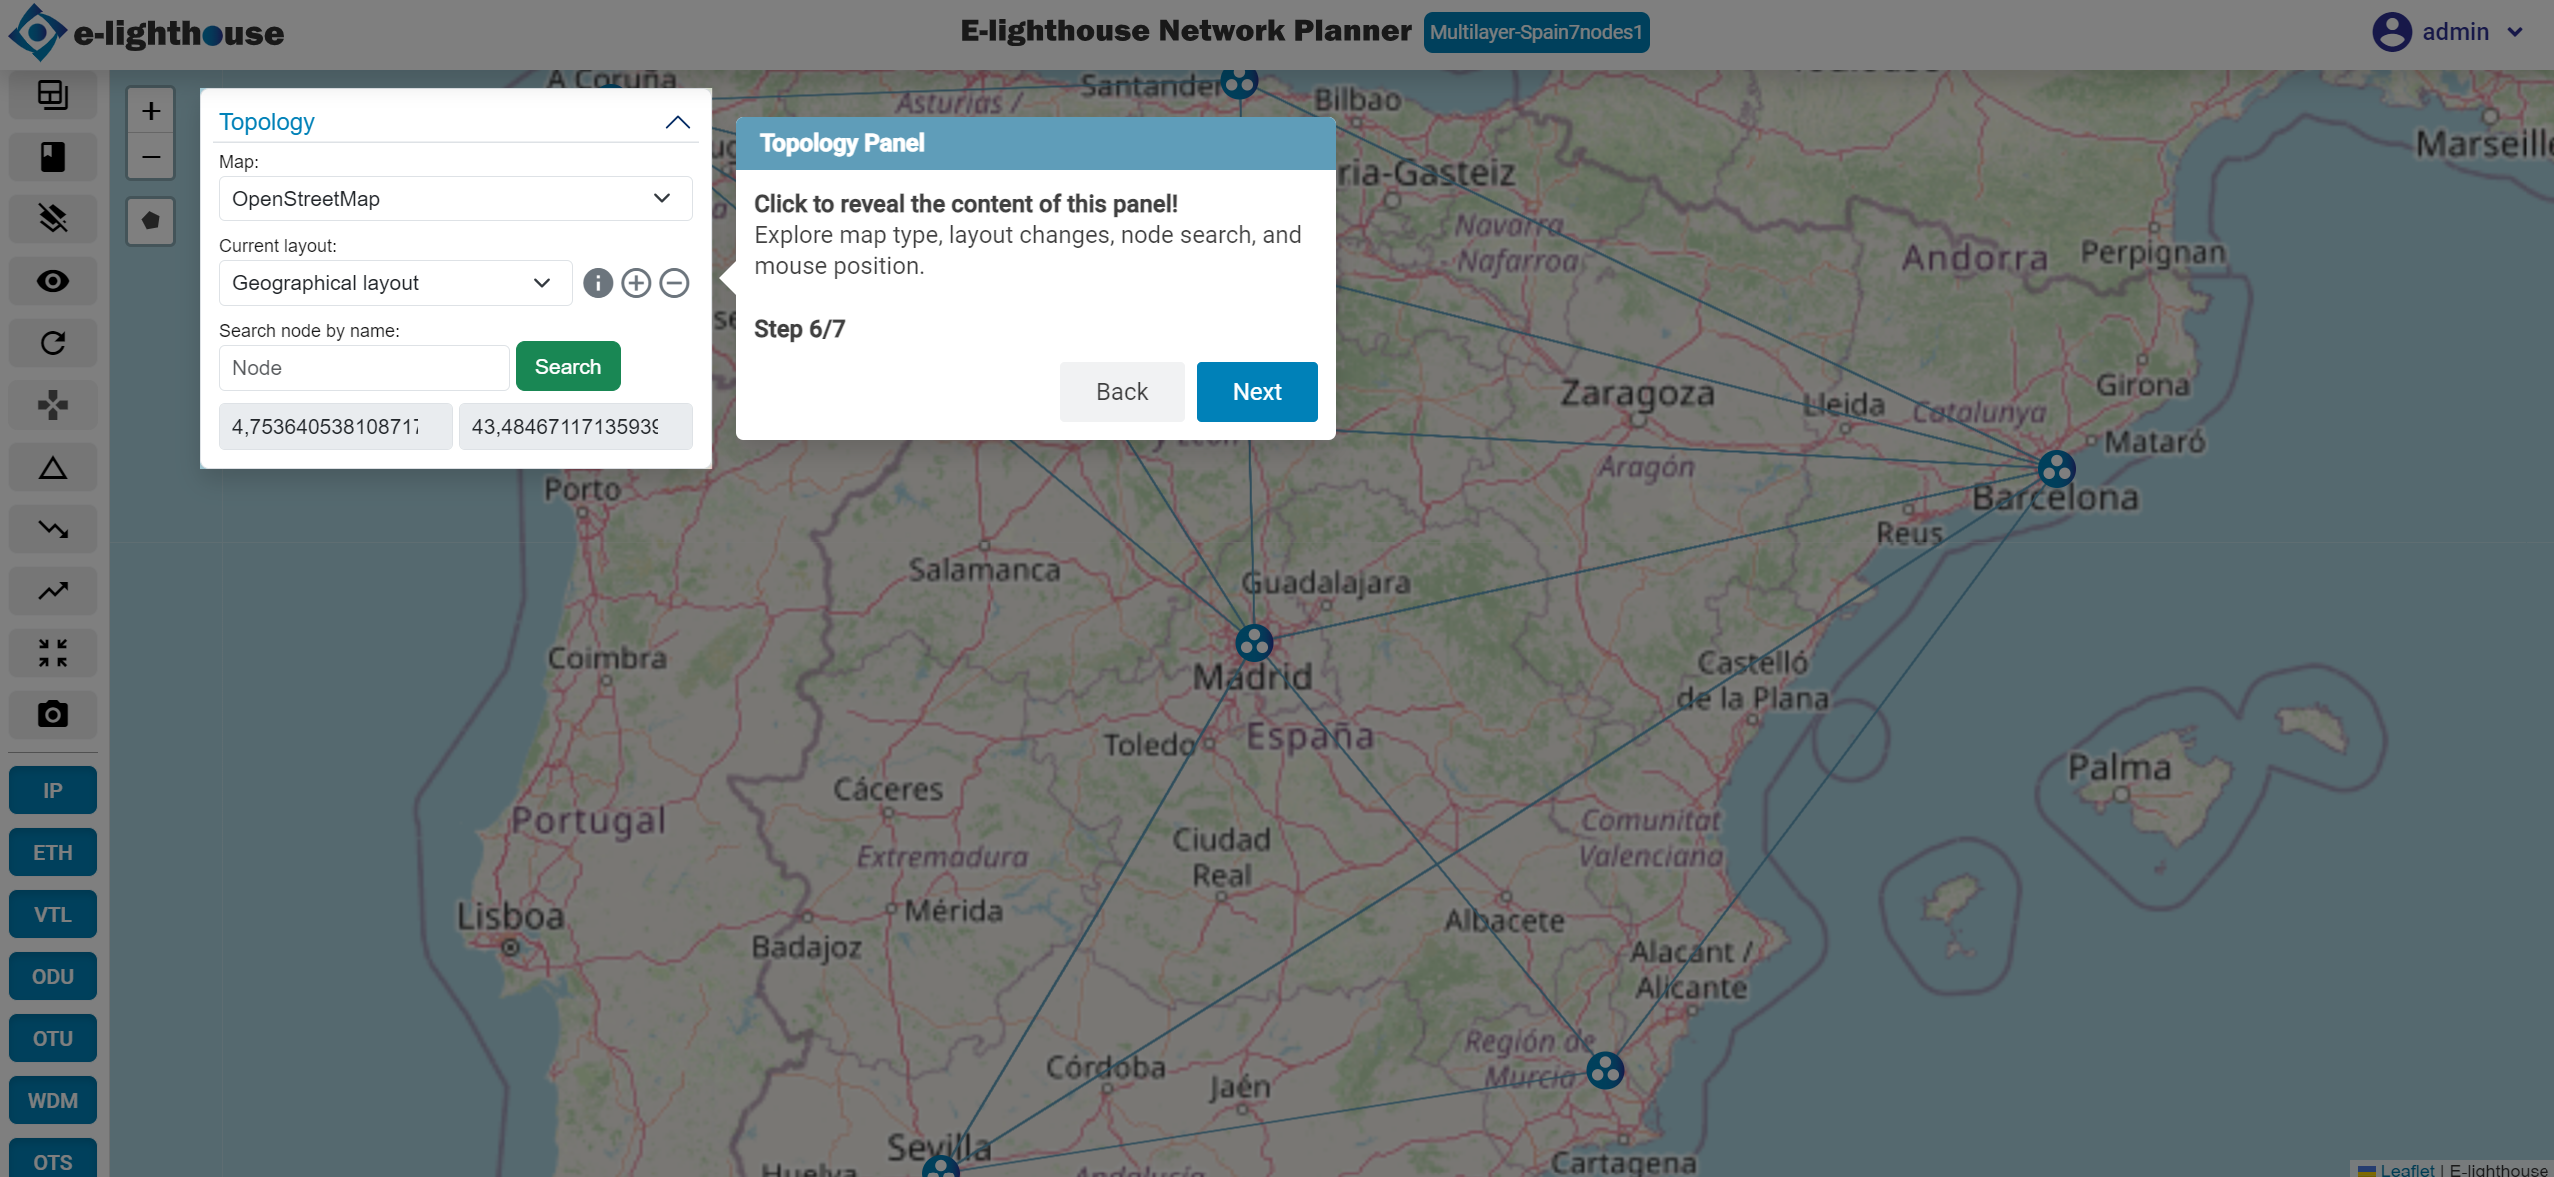
Step 6 of 7: Topology Panel
Expand this panel to change the map type, switch layouts, search for nodes, and track mouse position.
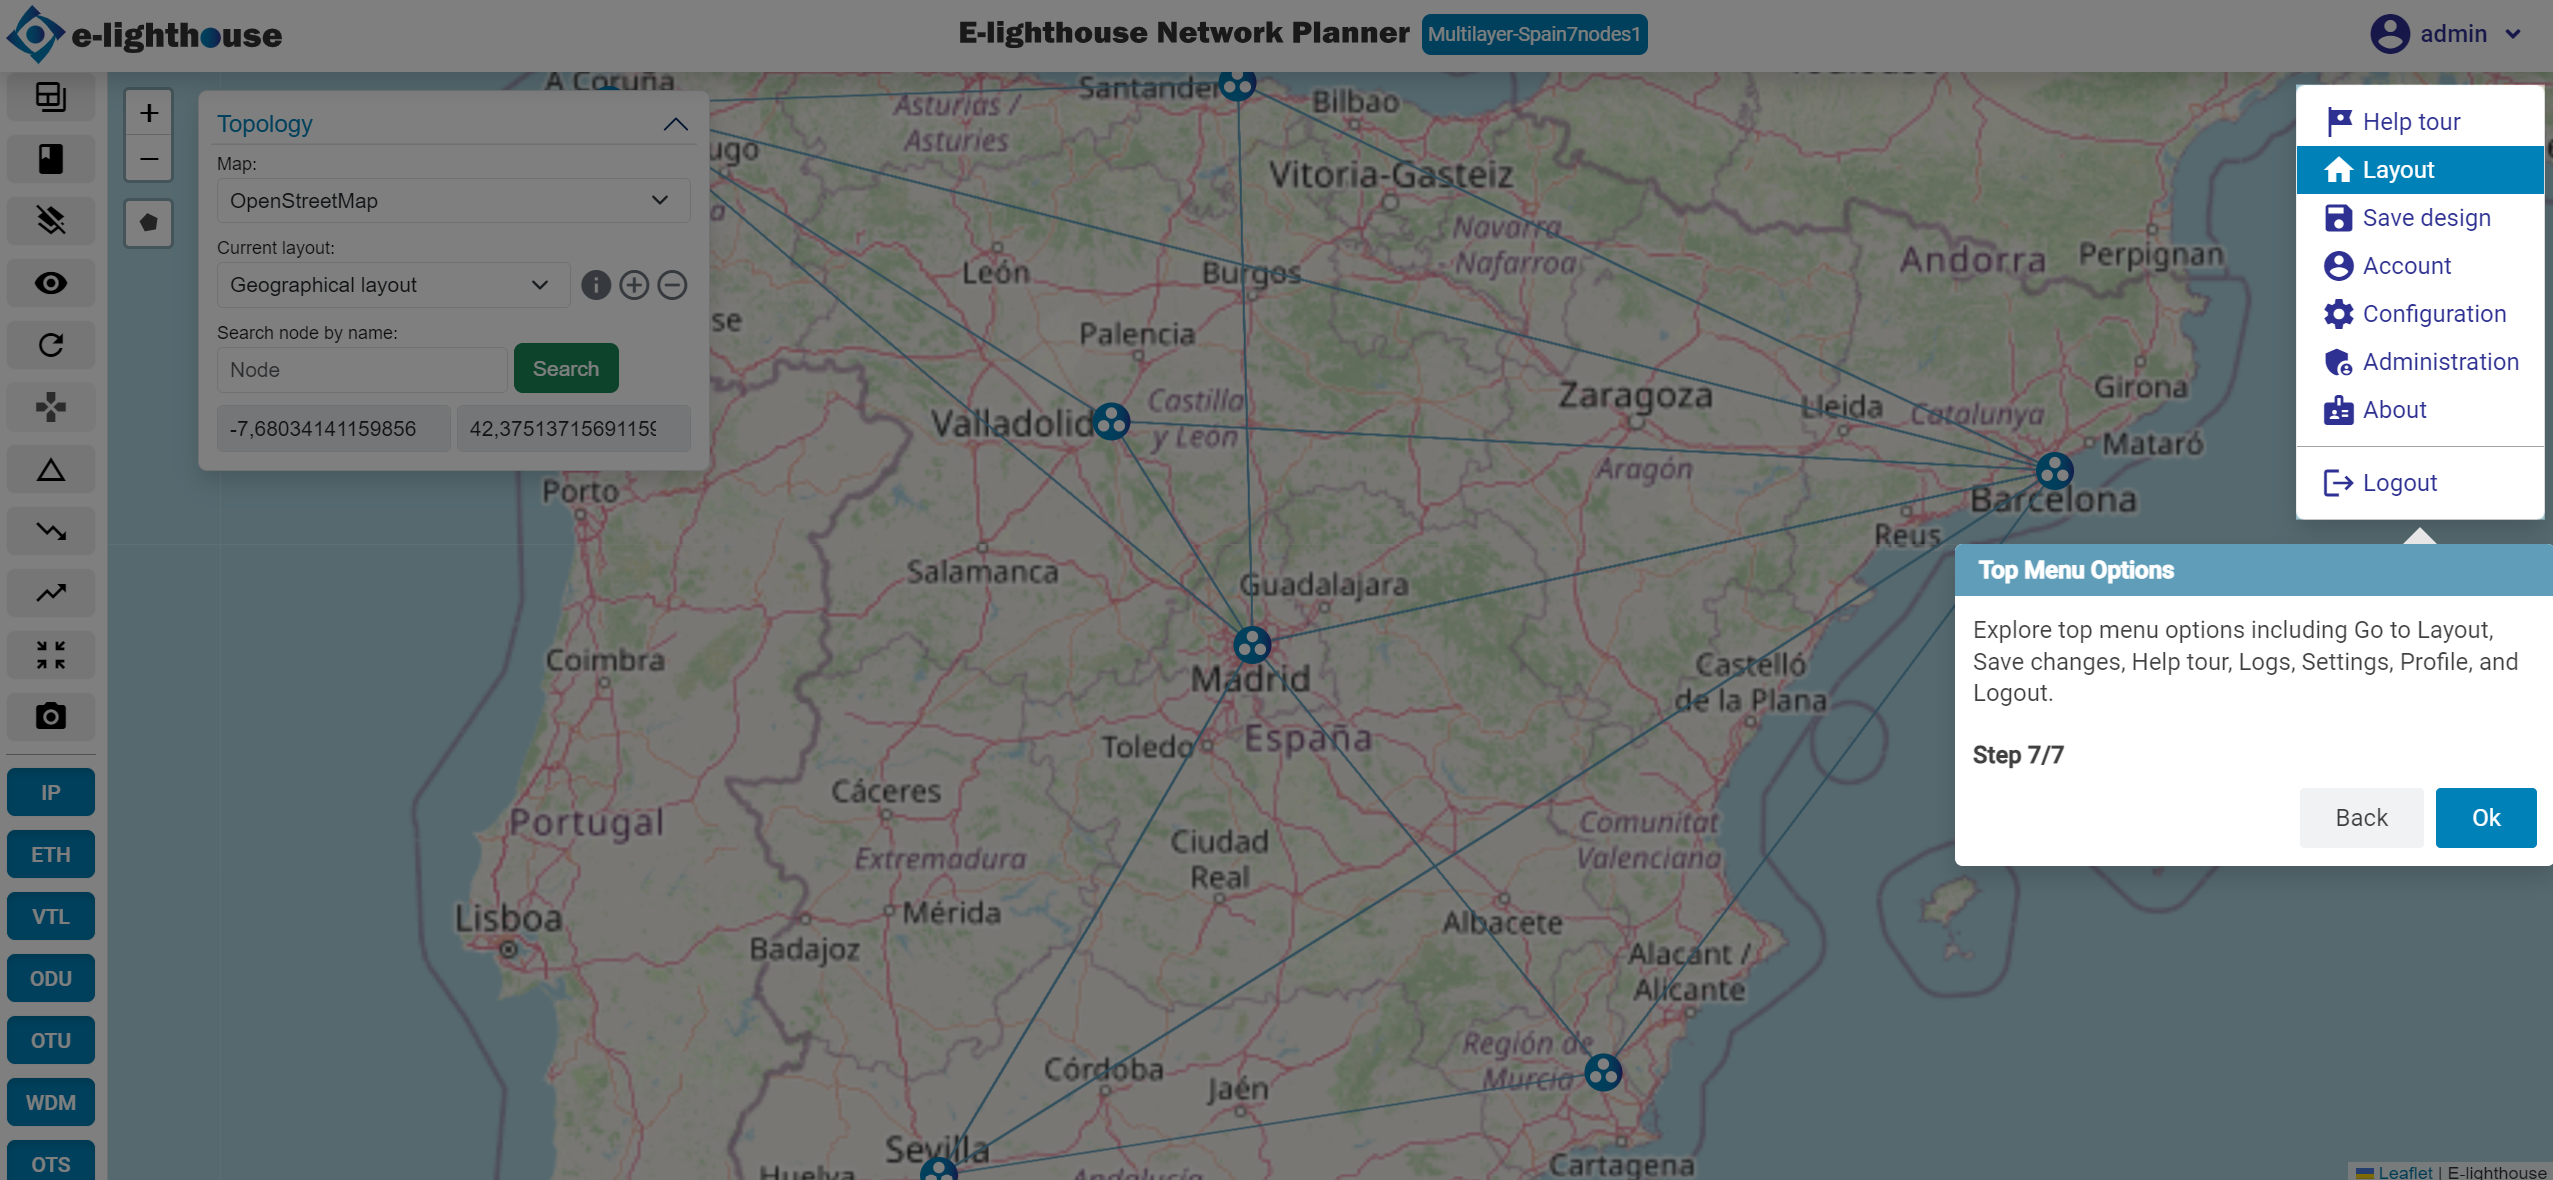
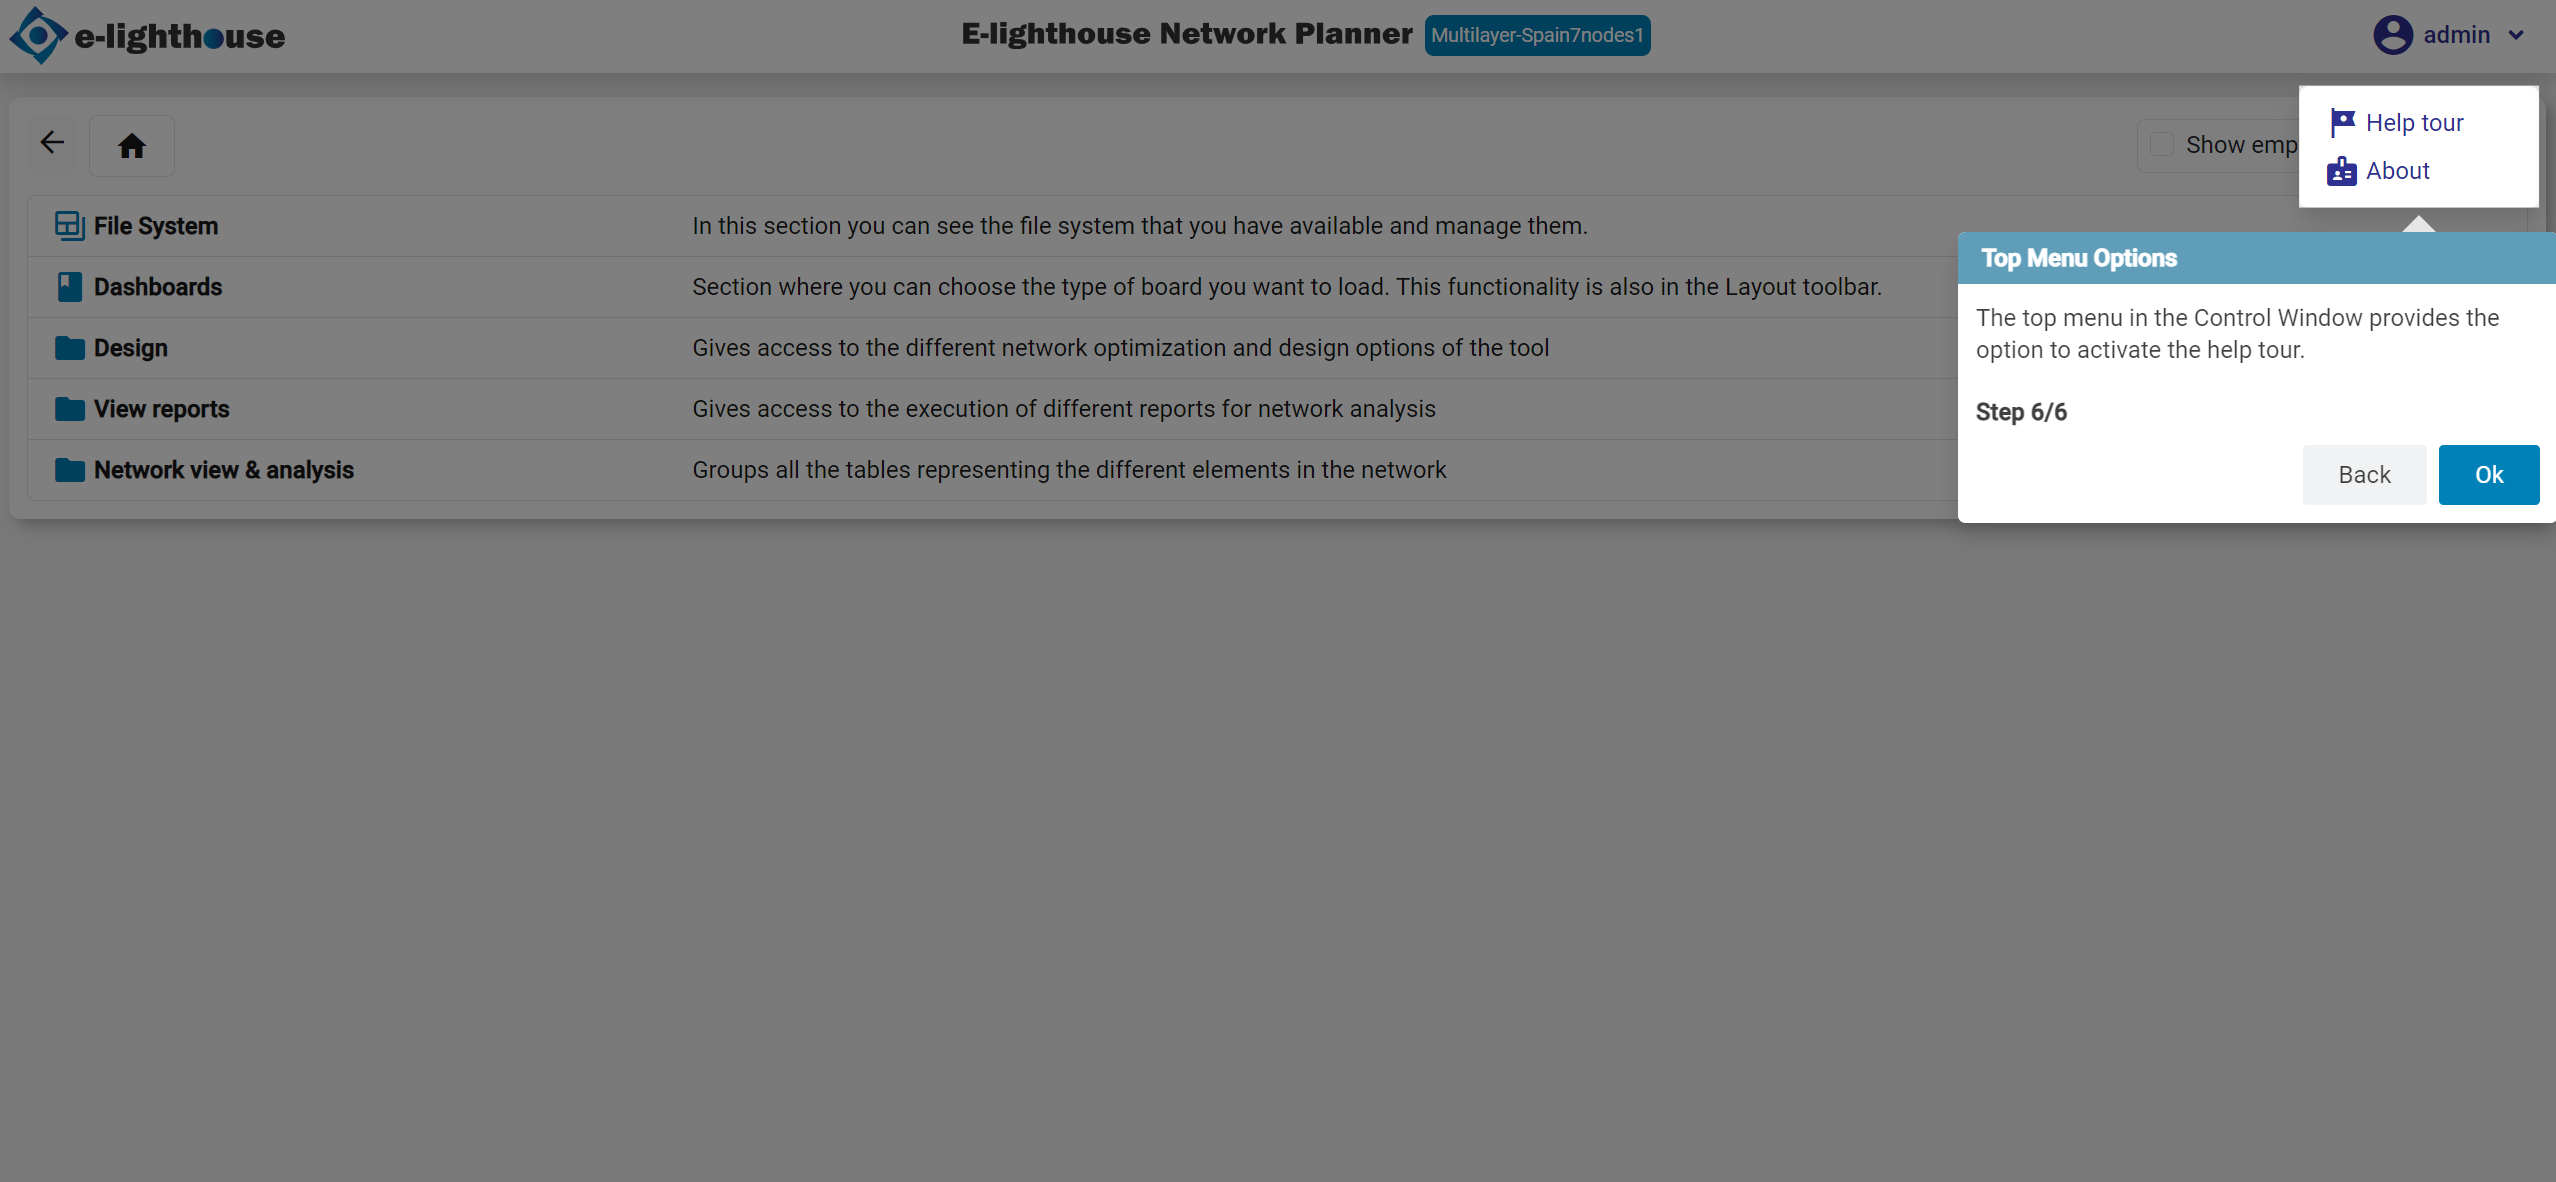
Step 7 of 7: Top Menu Options
Access essential options such as "Go to Topology", "Save", "Help Tour", "Logs", "Settings", "Profile", and "Logout".
🪟 Tour in Control Window View
👀 Want to dive deeper?
Control Window View →
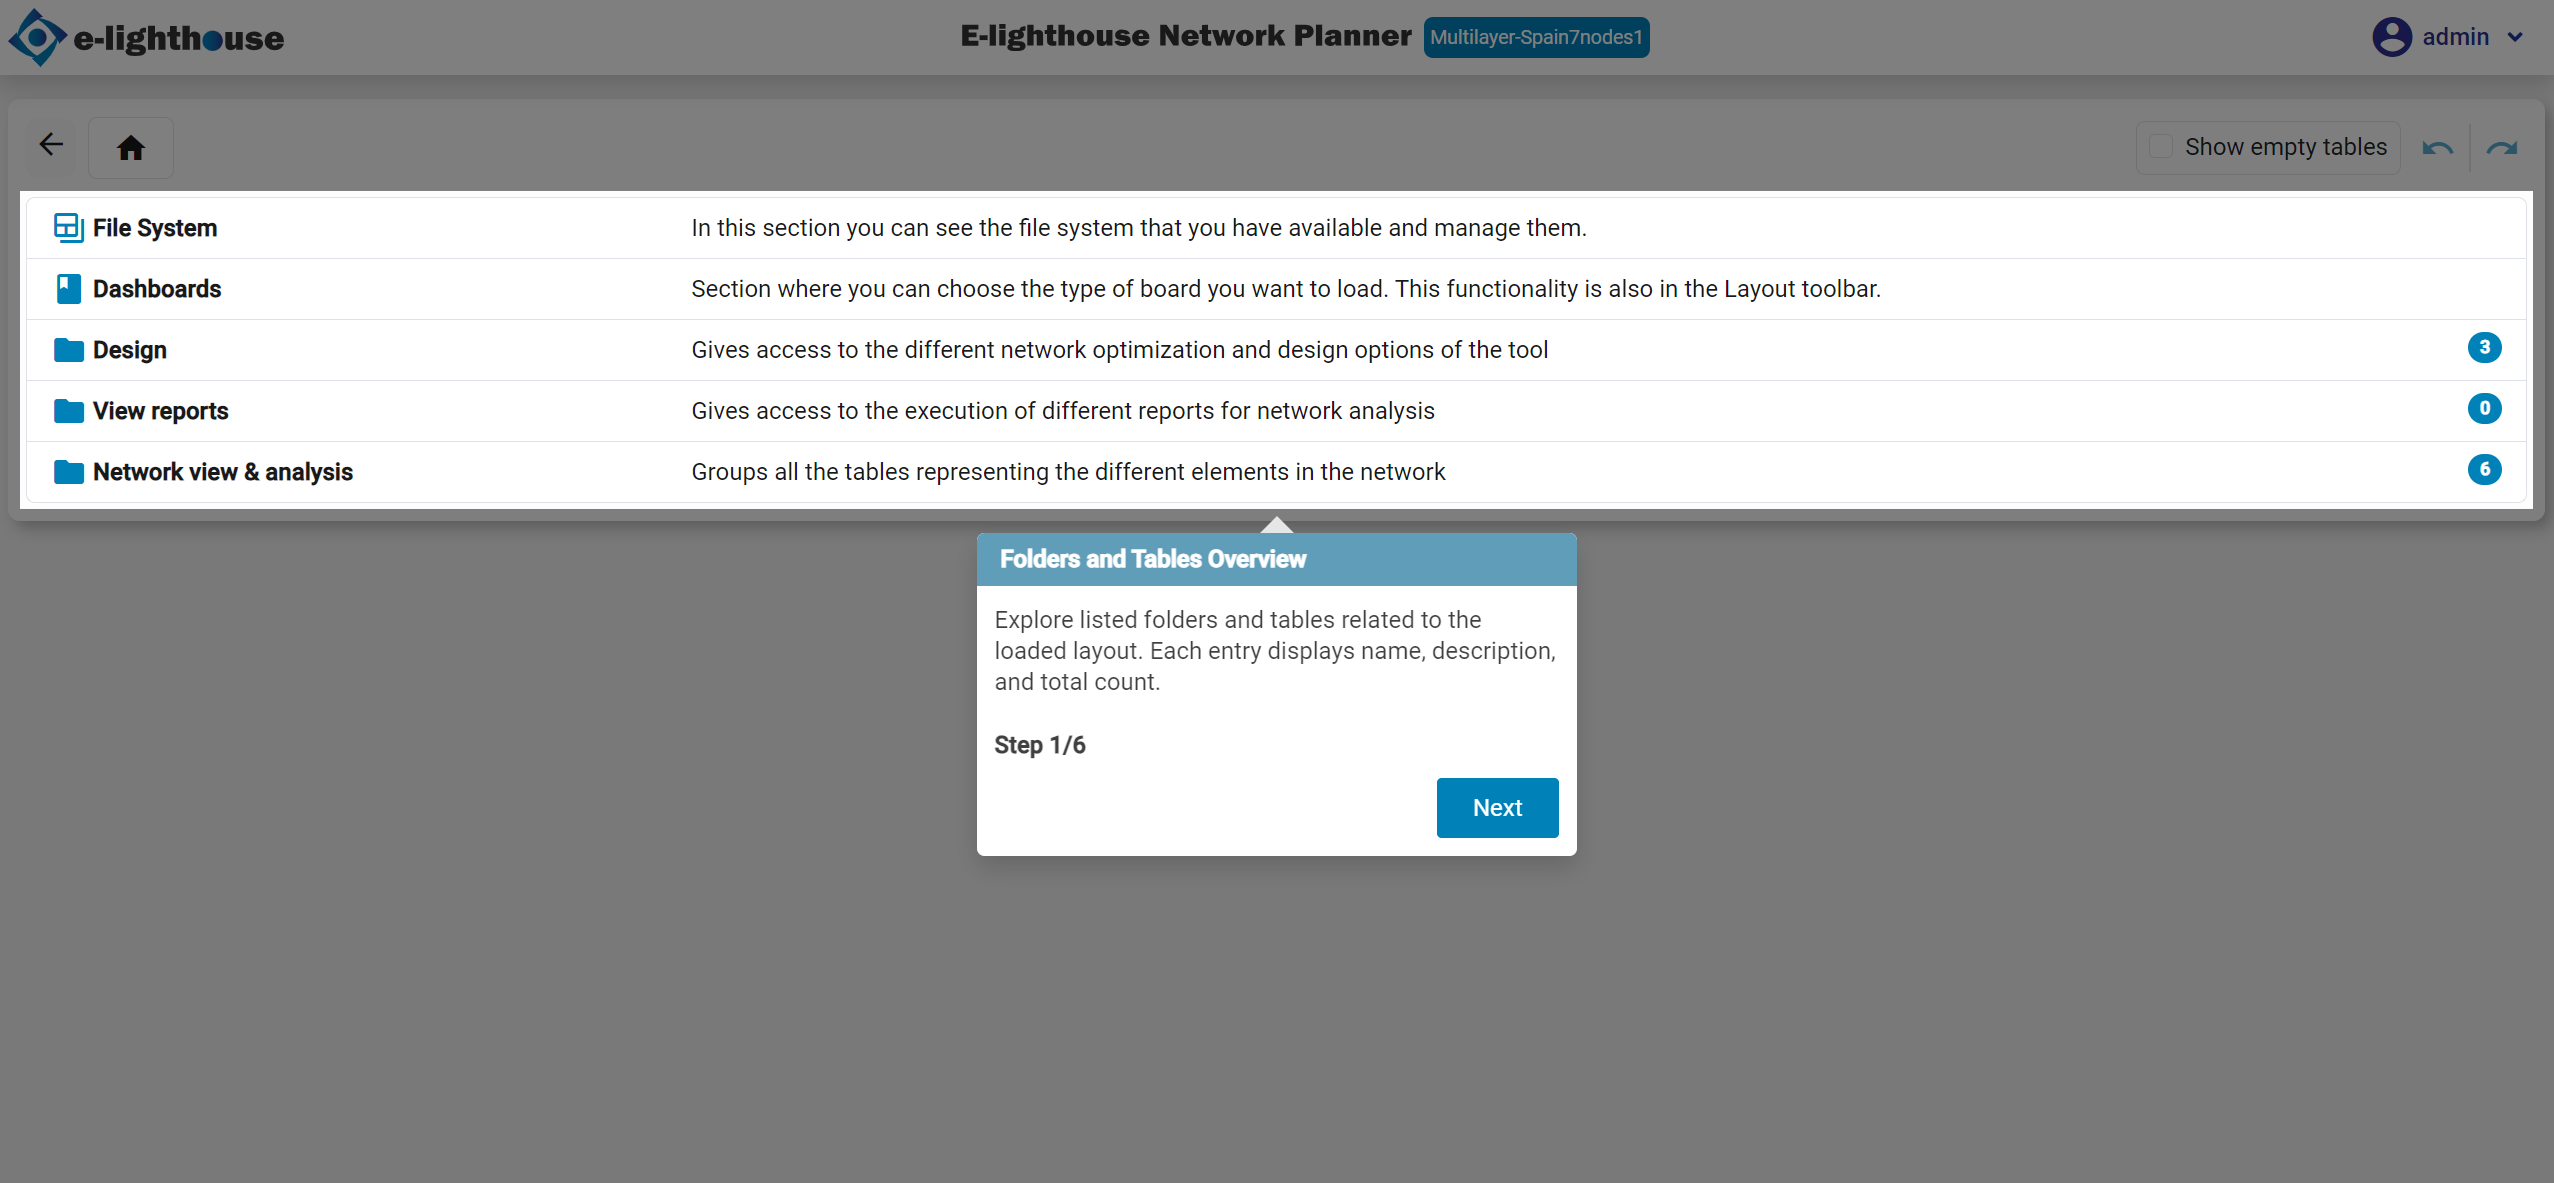
Step 1 of 10: Folders and Tables Overview
Explore folders and data tables related to the currently loaded topology. Each item shows its name, description, and total row count.
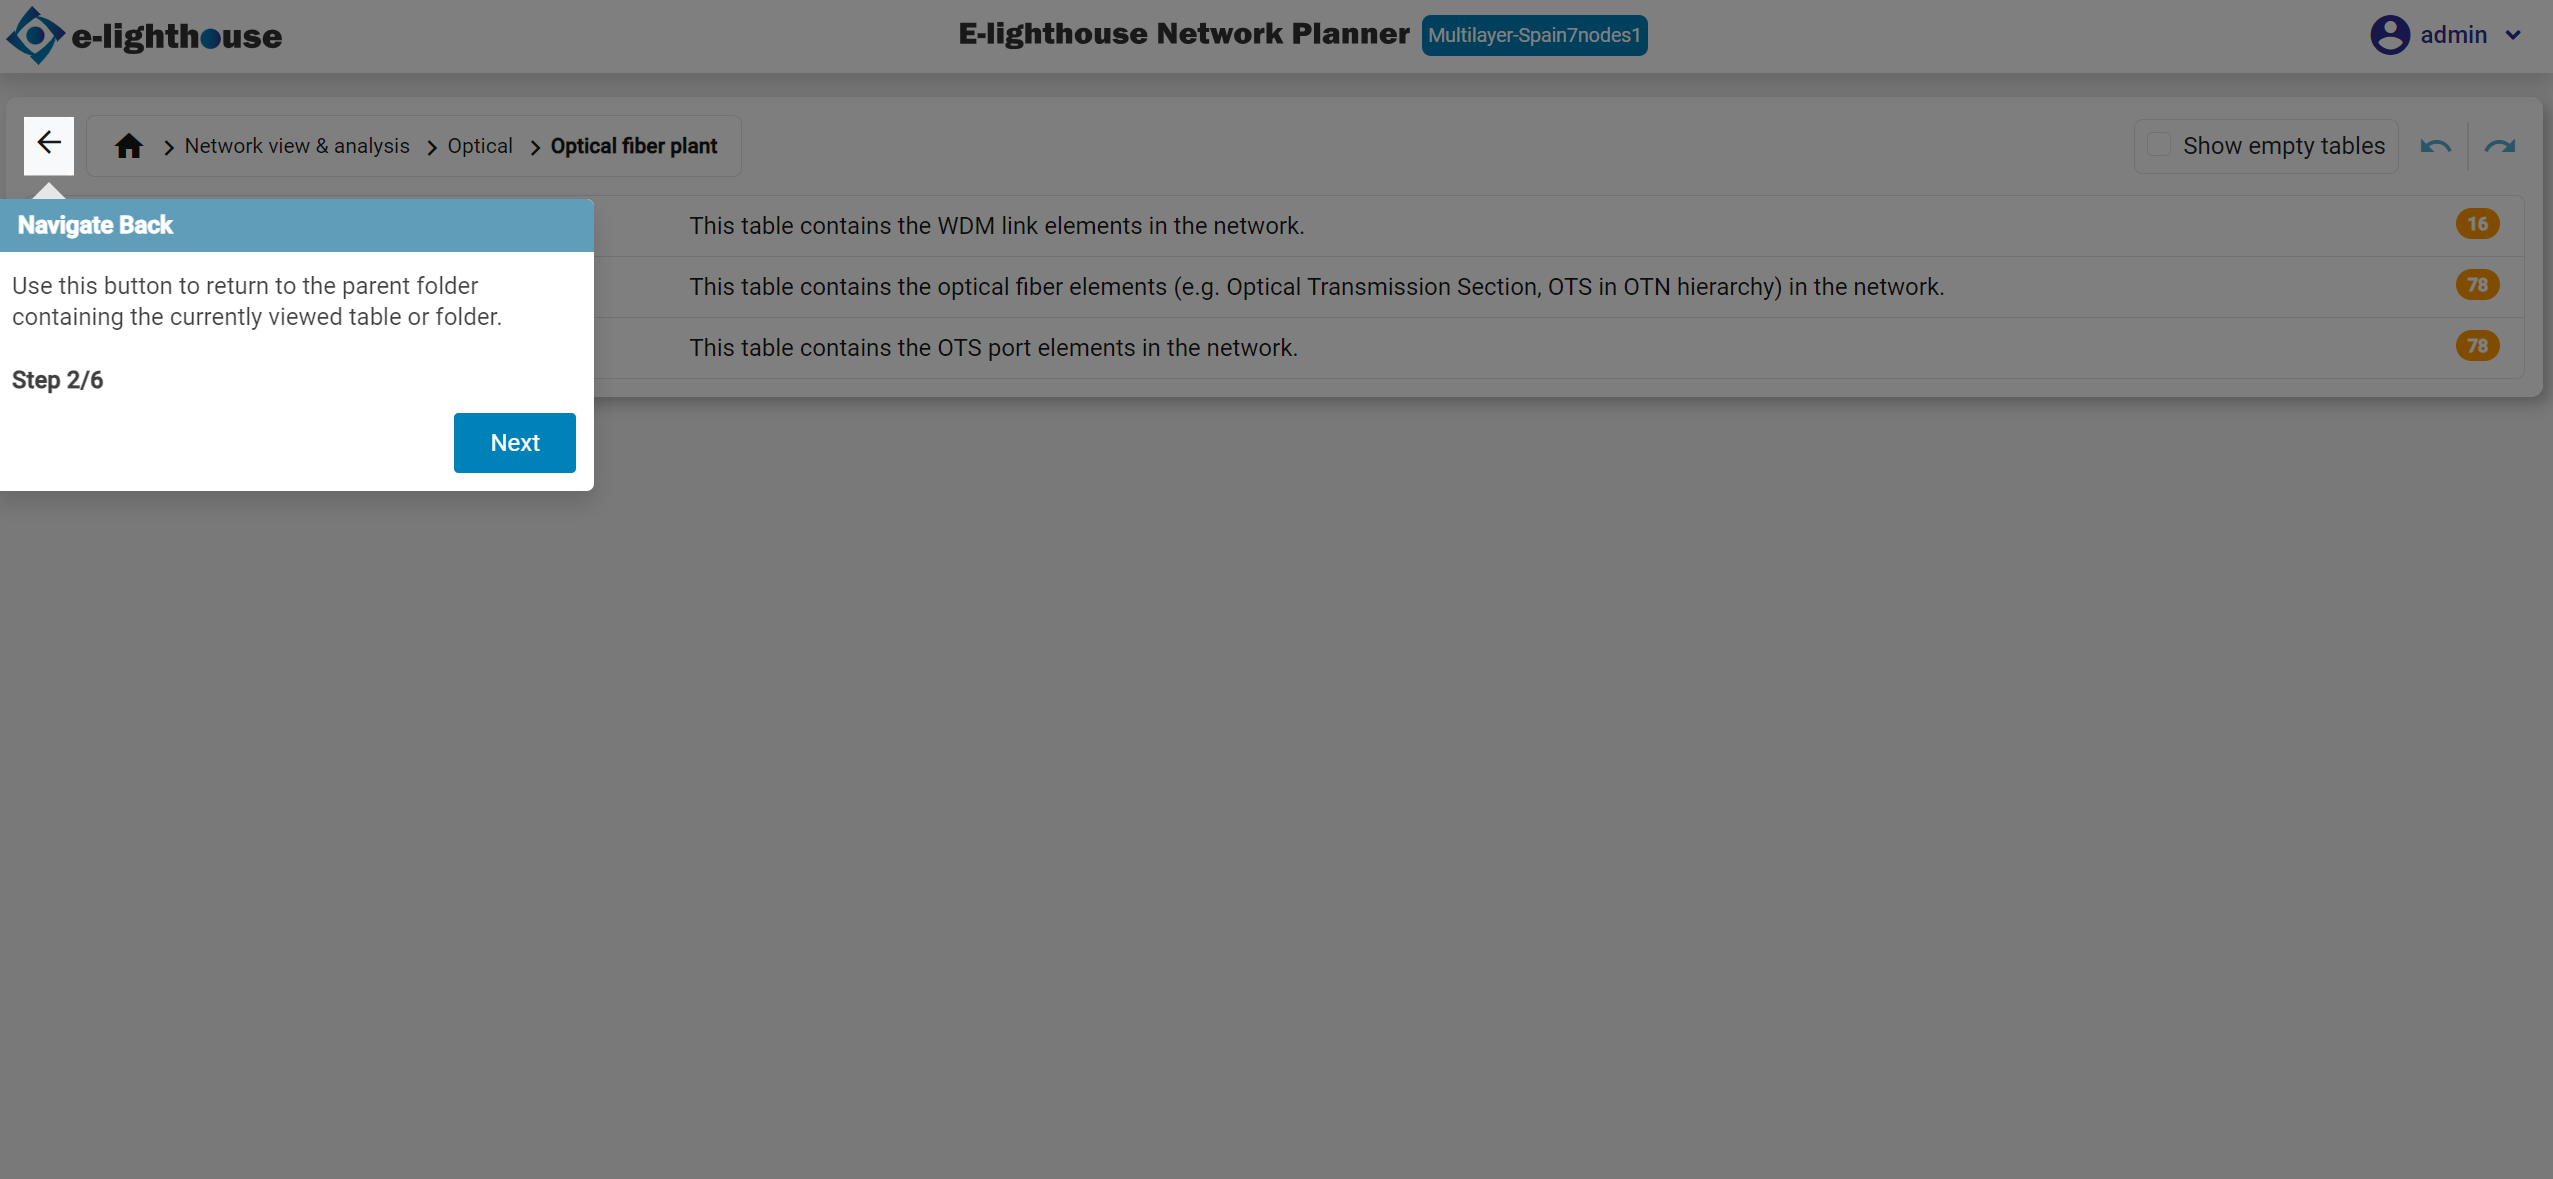
Step 2 of 10: Navigate Back
Click the back arrow to return to the parent folder containing the current table or subfolder.
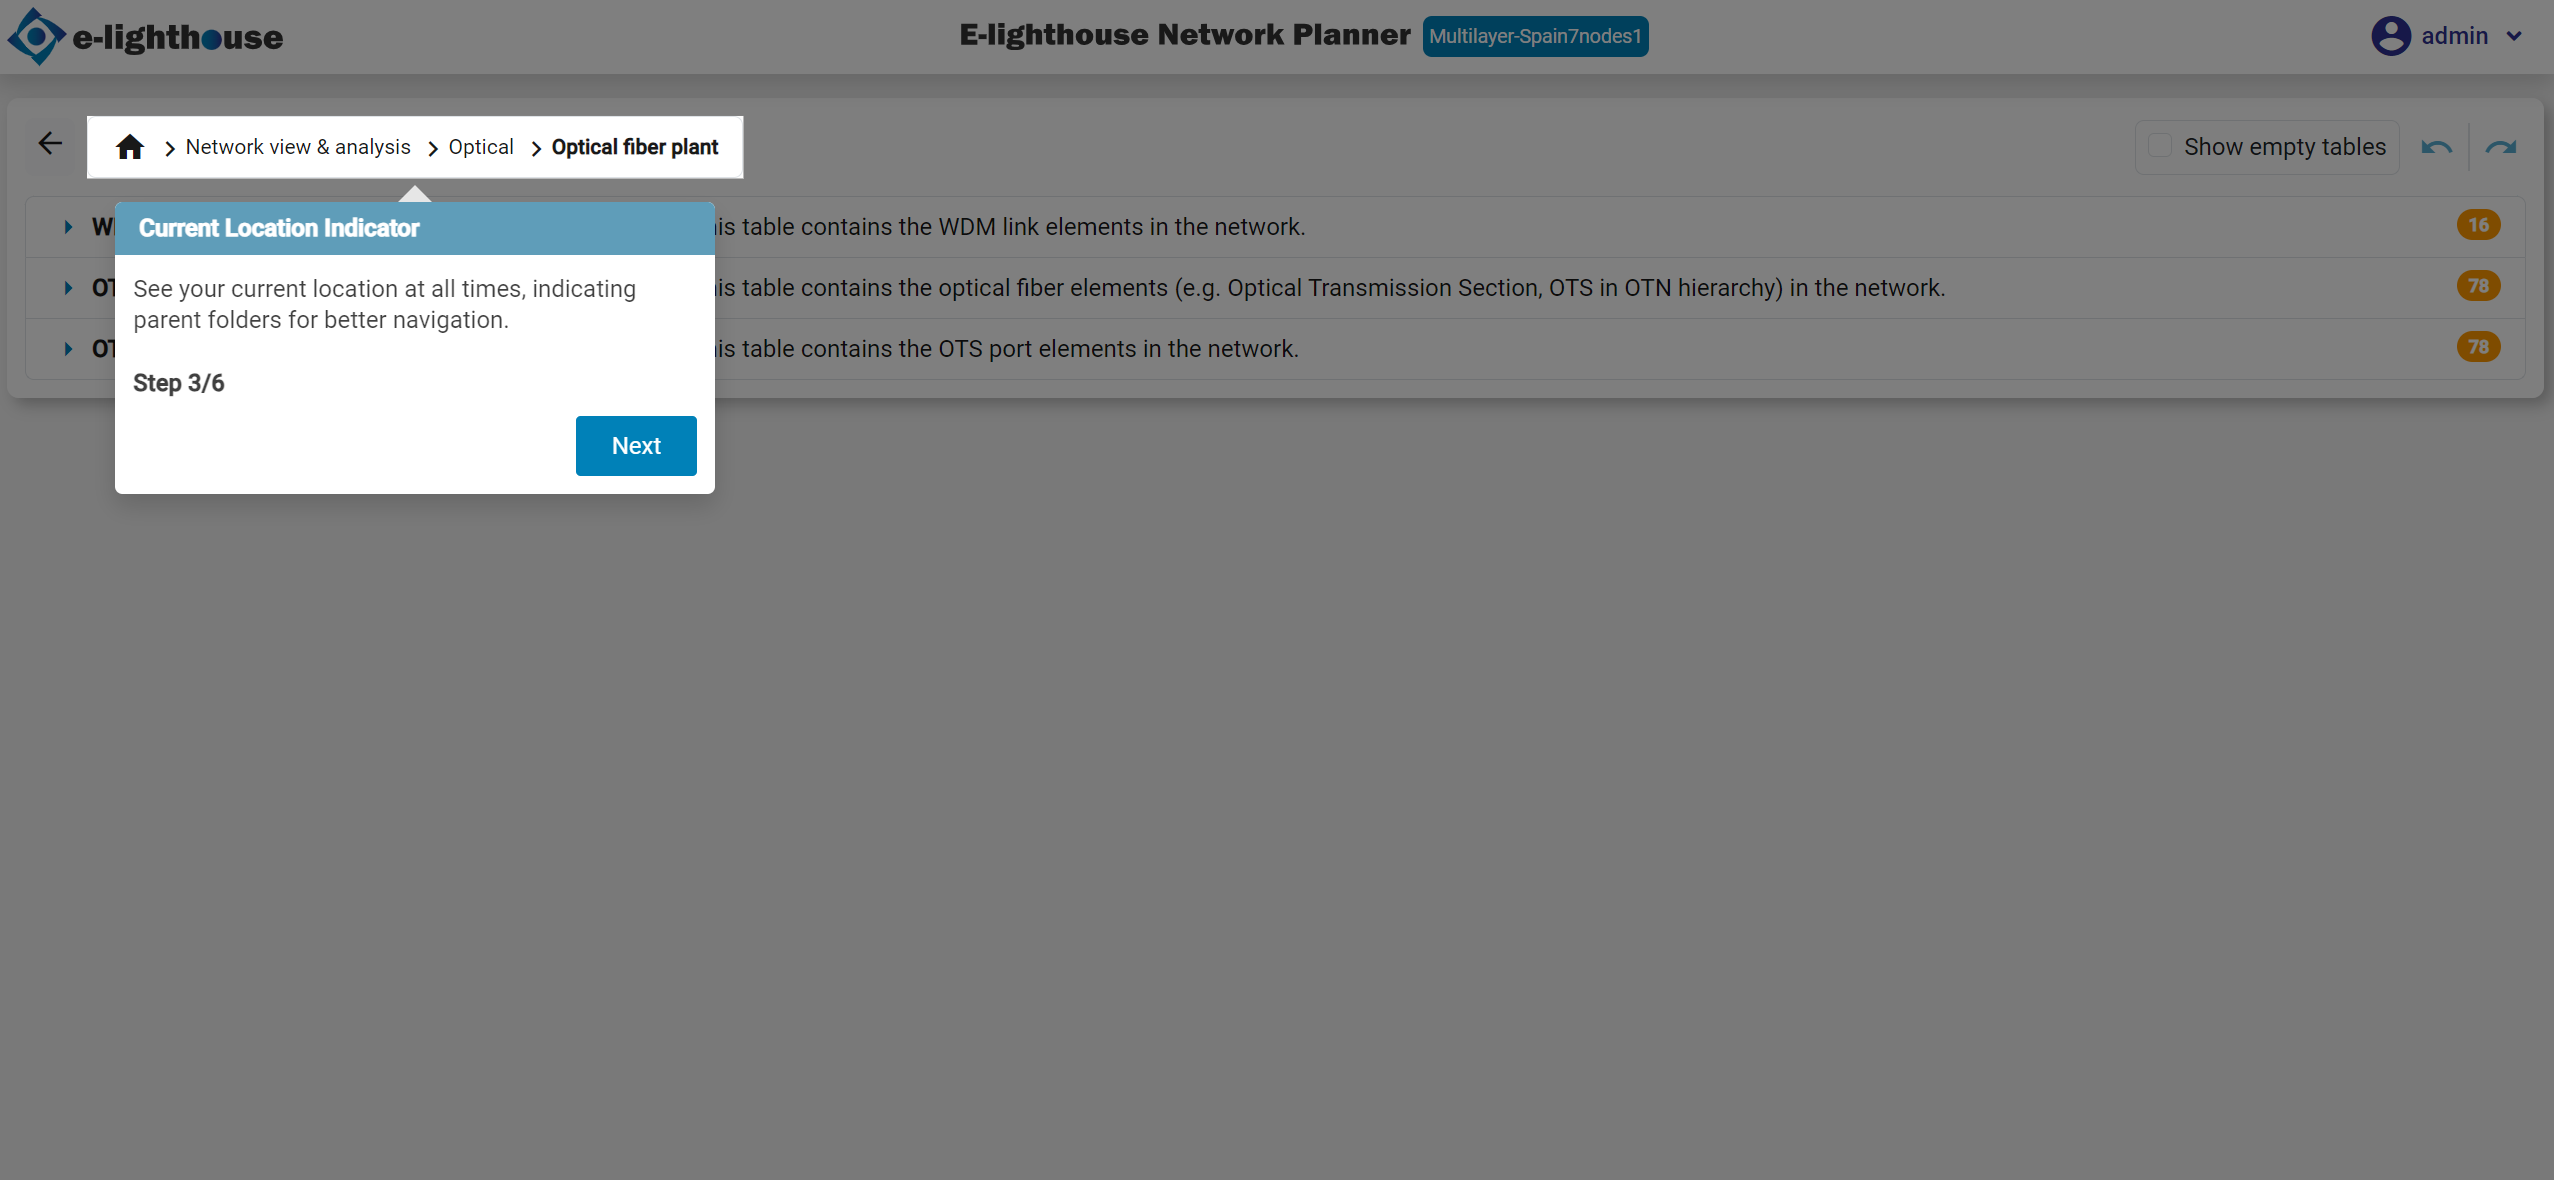
Step 3 of 10: Current Location Identifier
Check this section to view your current location and hierarchy of parent folders for better context during navigation.
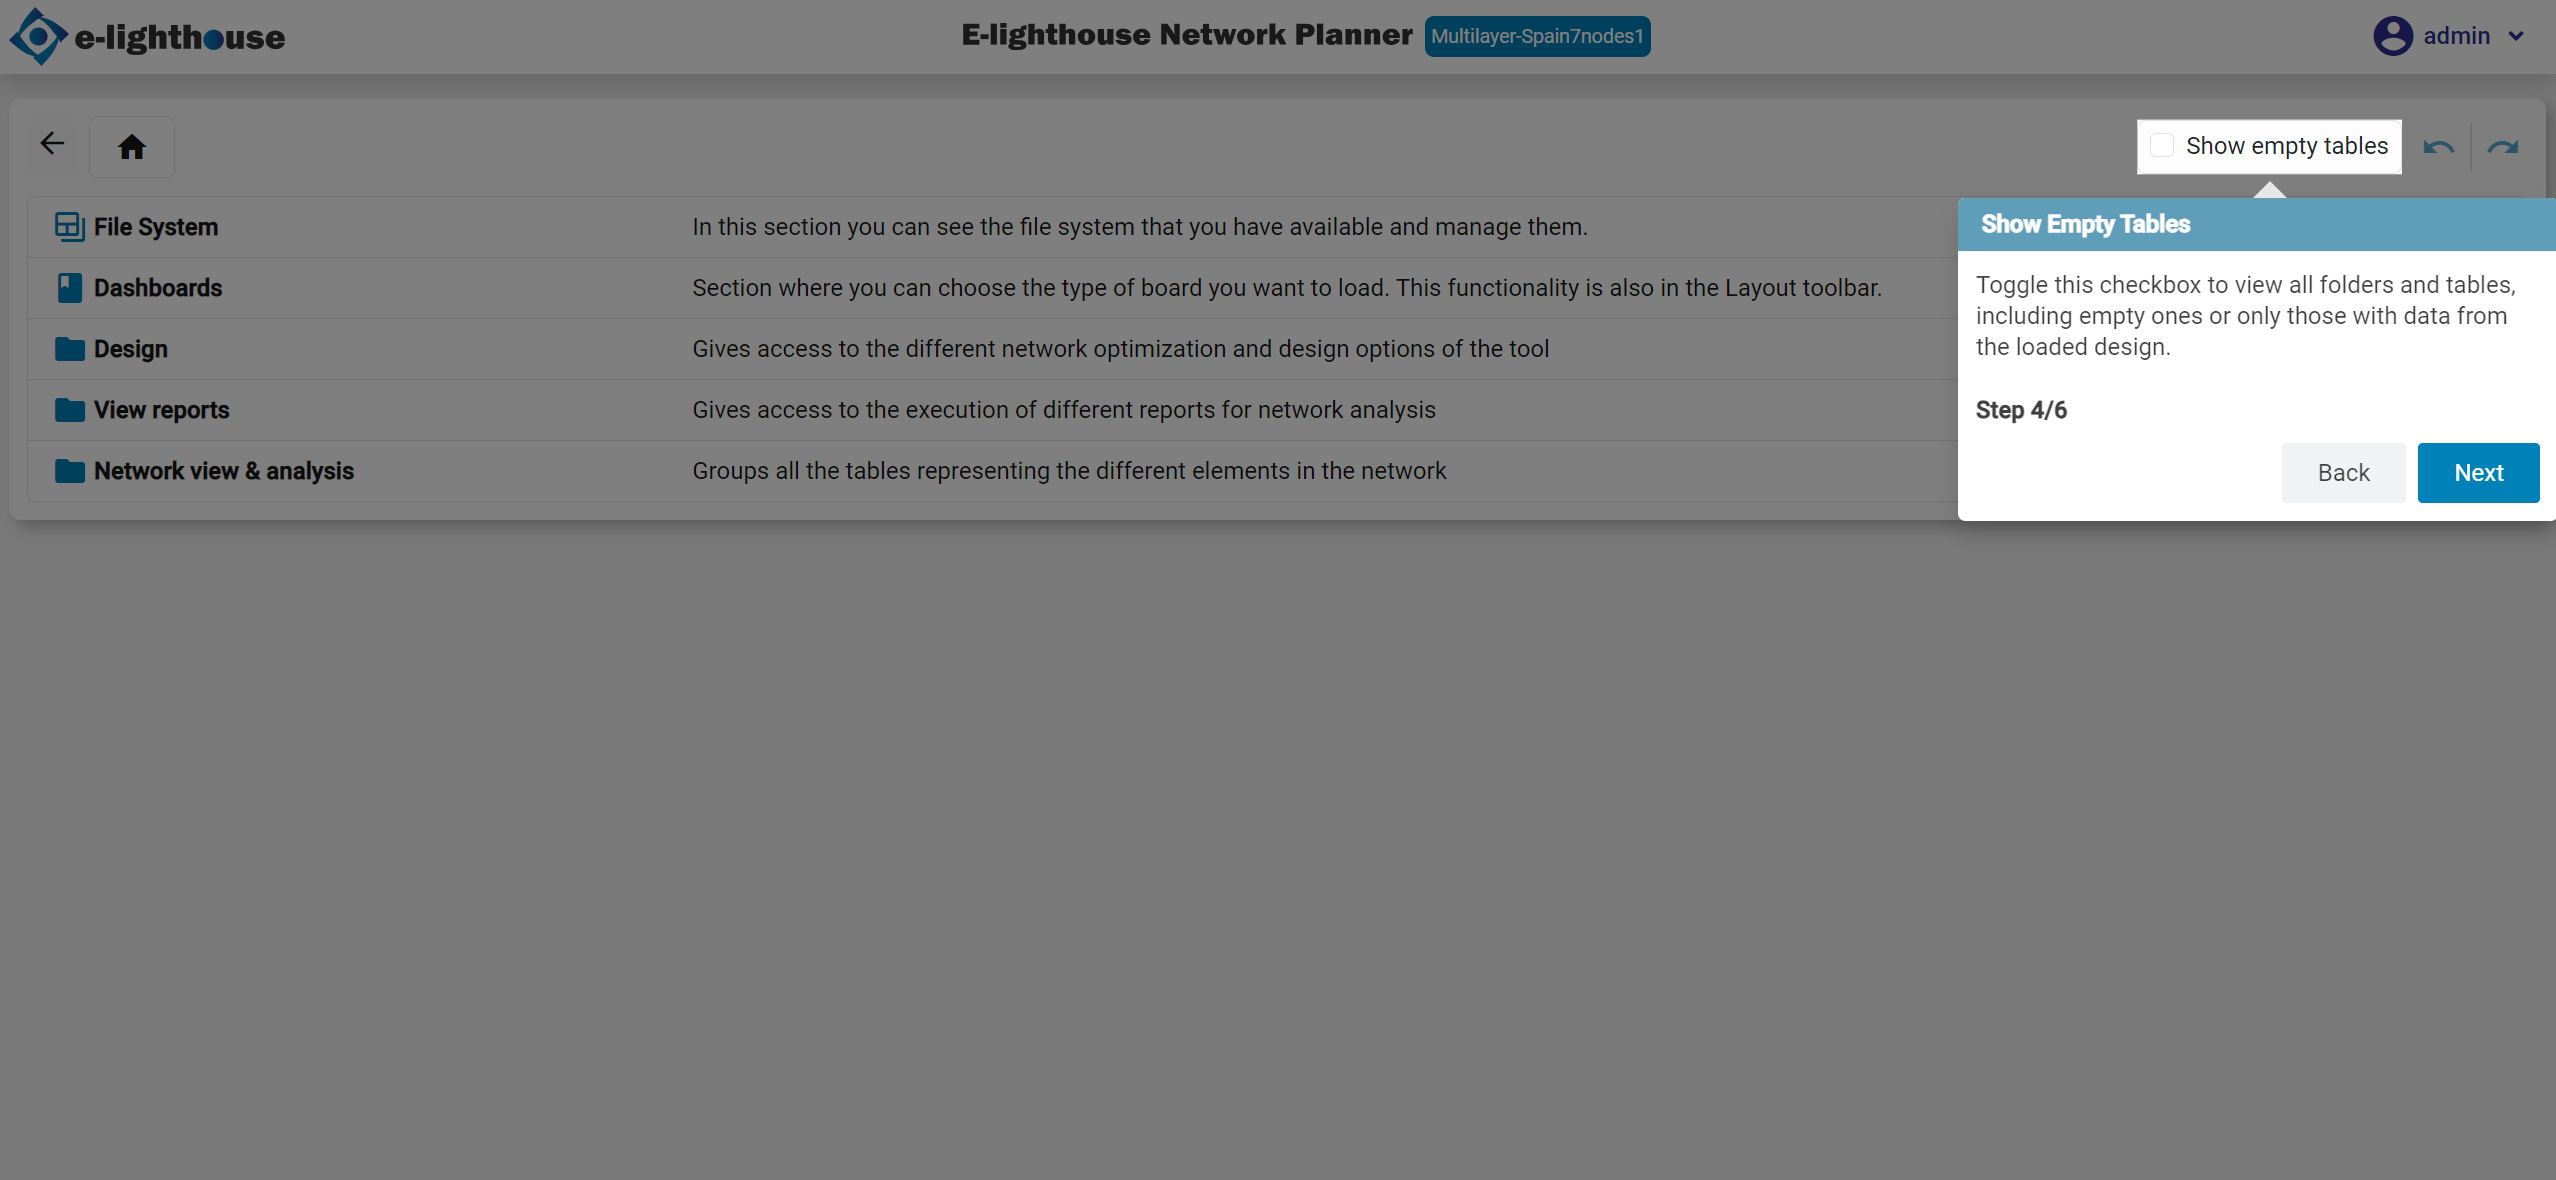
Step 4 of 10: Show Empty Tables
Toggle this checkbox to show all folders and tables — even if some are empty or contain no relevant data from the current topology.
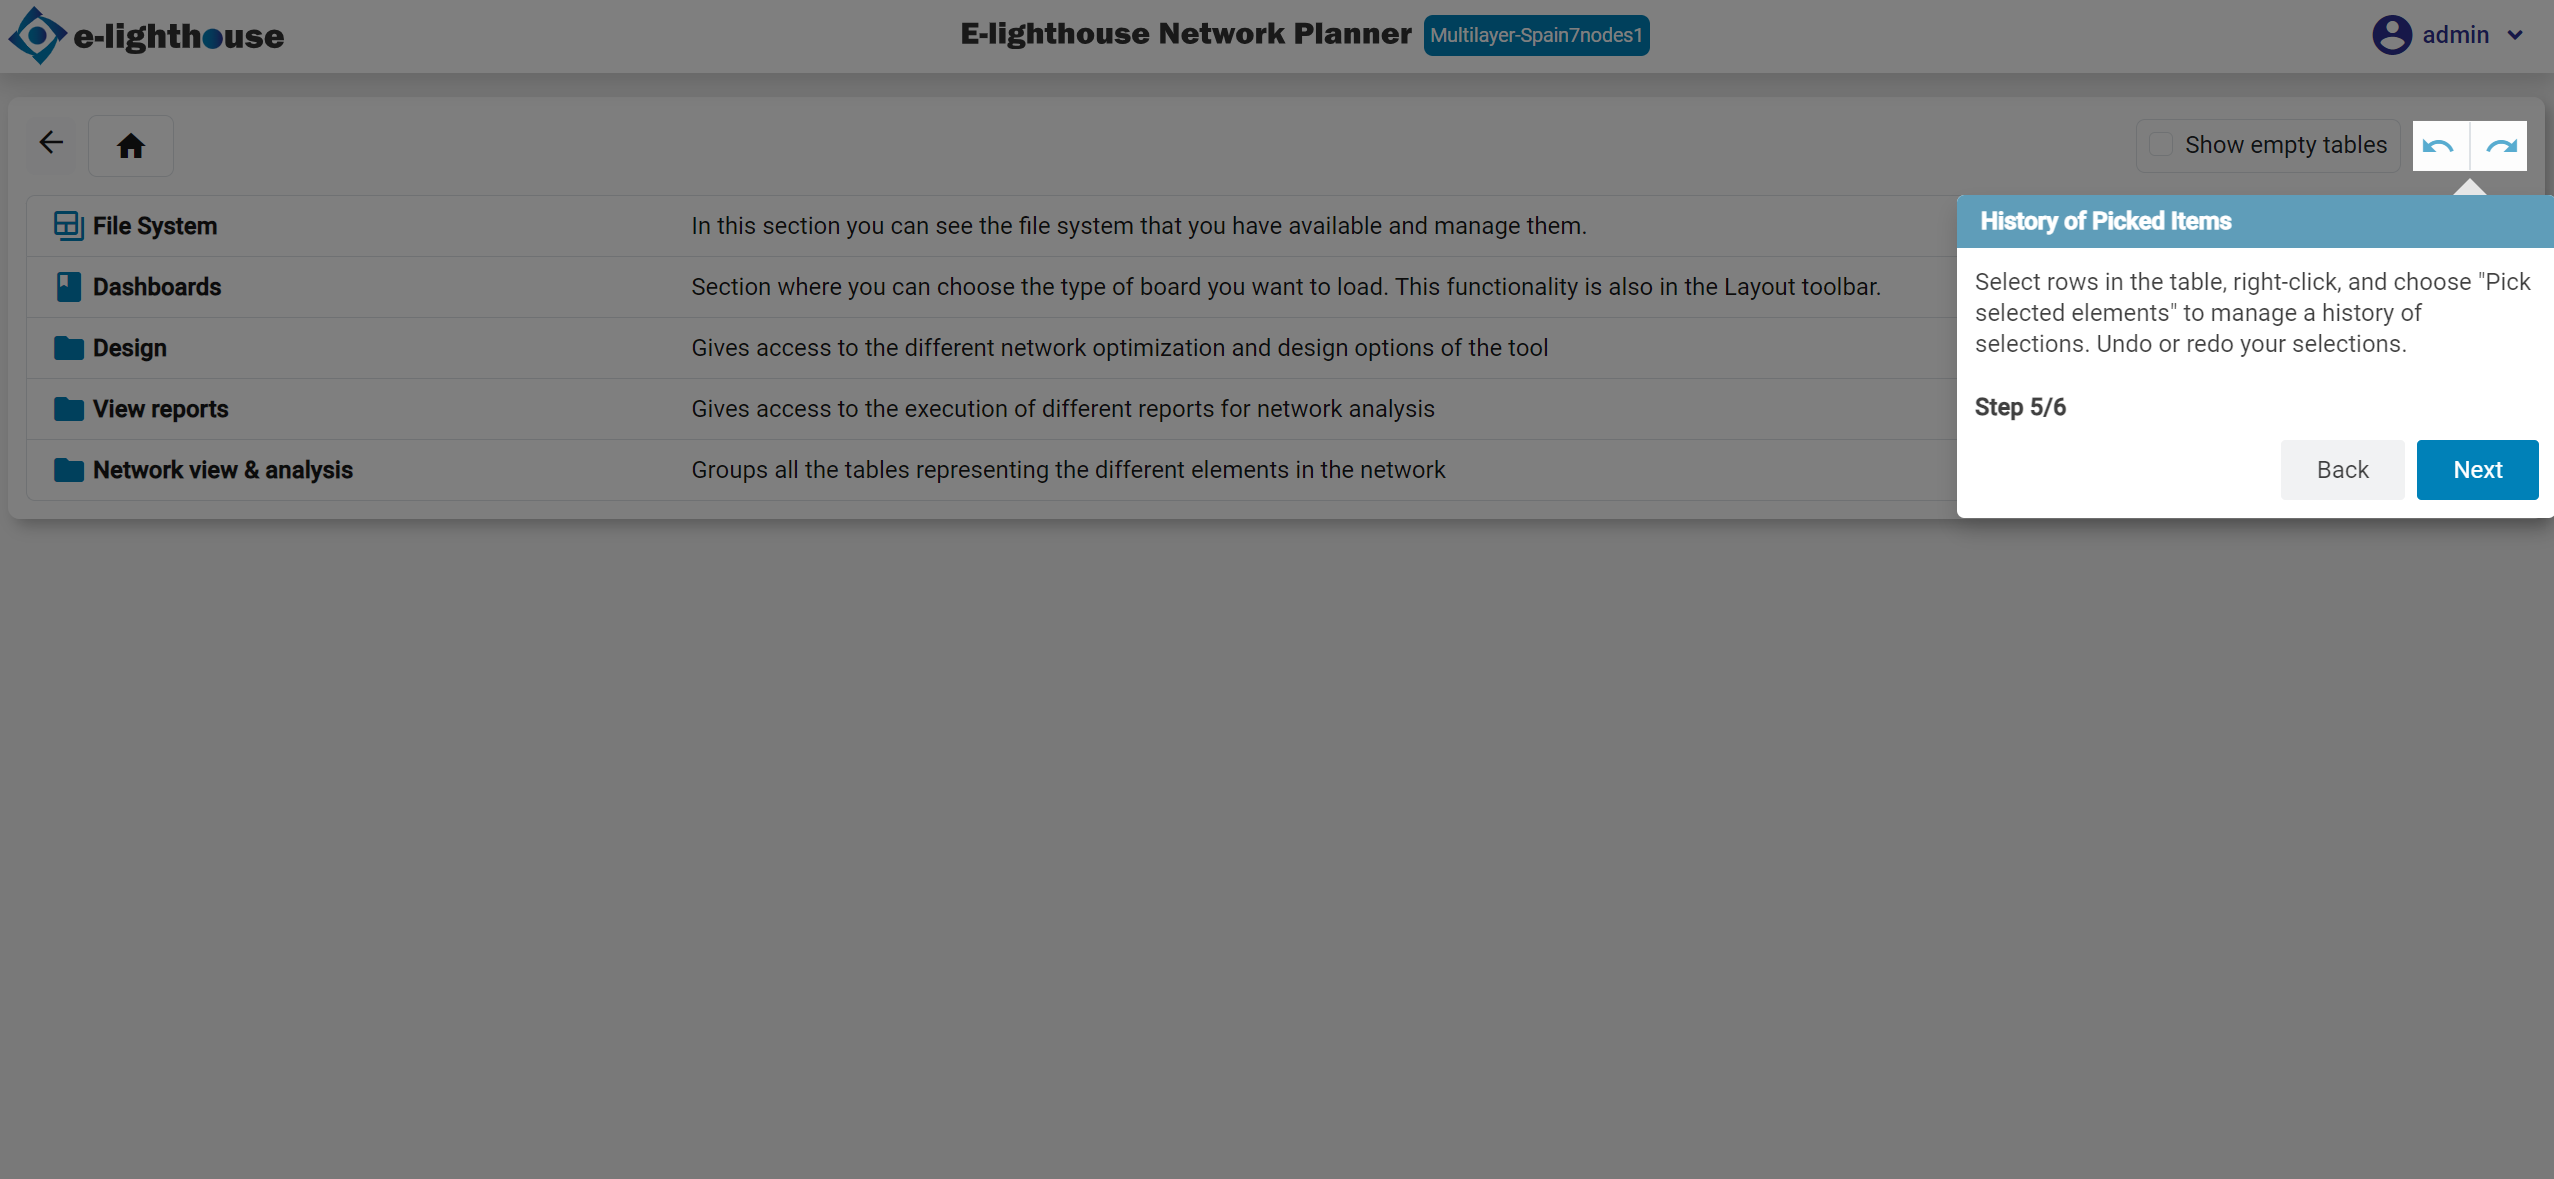
Step 5 of 10: History of Picked Items
Right-click and choose "Pick selected elements" to track and manage selections. You can undo or redo these actions.
Step 6 of 10: Top Menu Options
Use the top menu bar to activate the help tour or access other view settings.
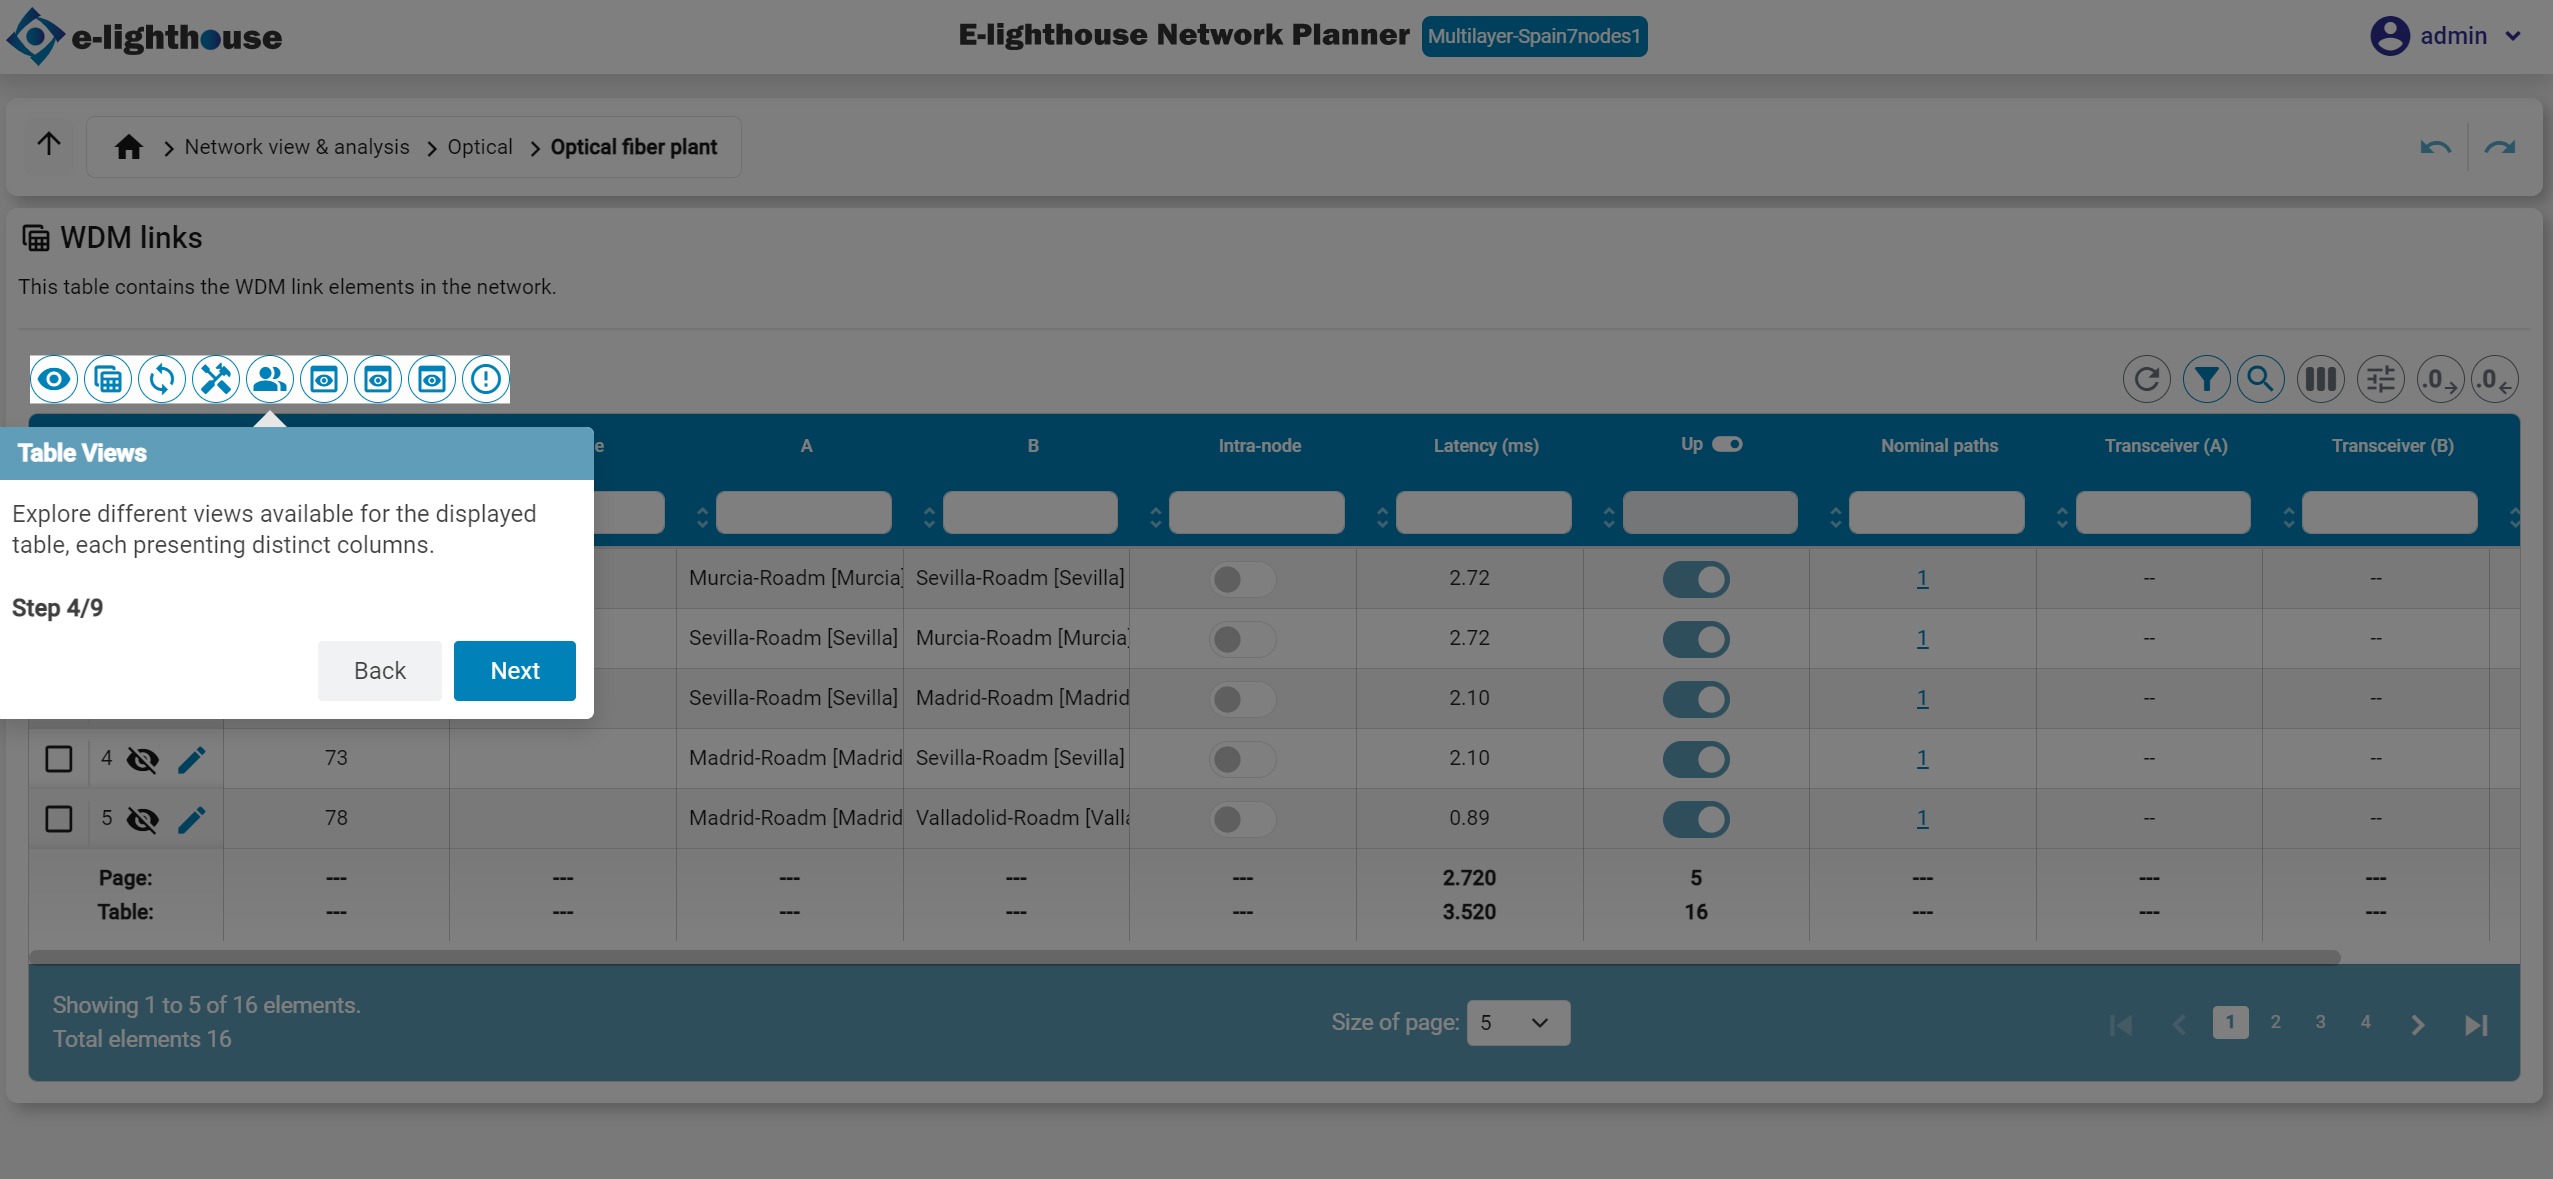
Step 7 of 10: Table Views
Switch between different display modes for the current table, each with its own set of columns and layout.
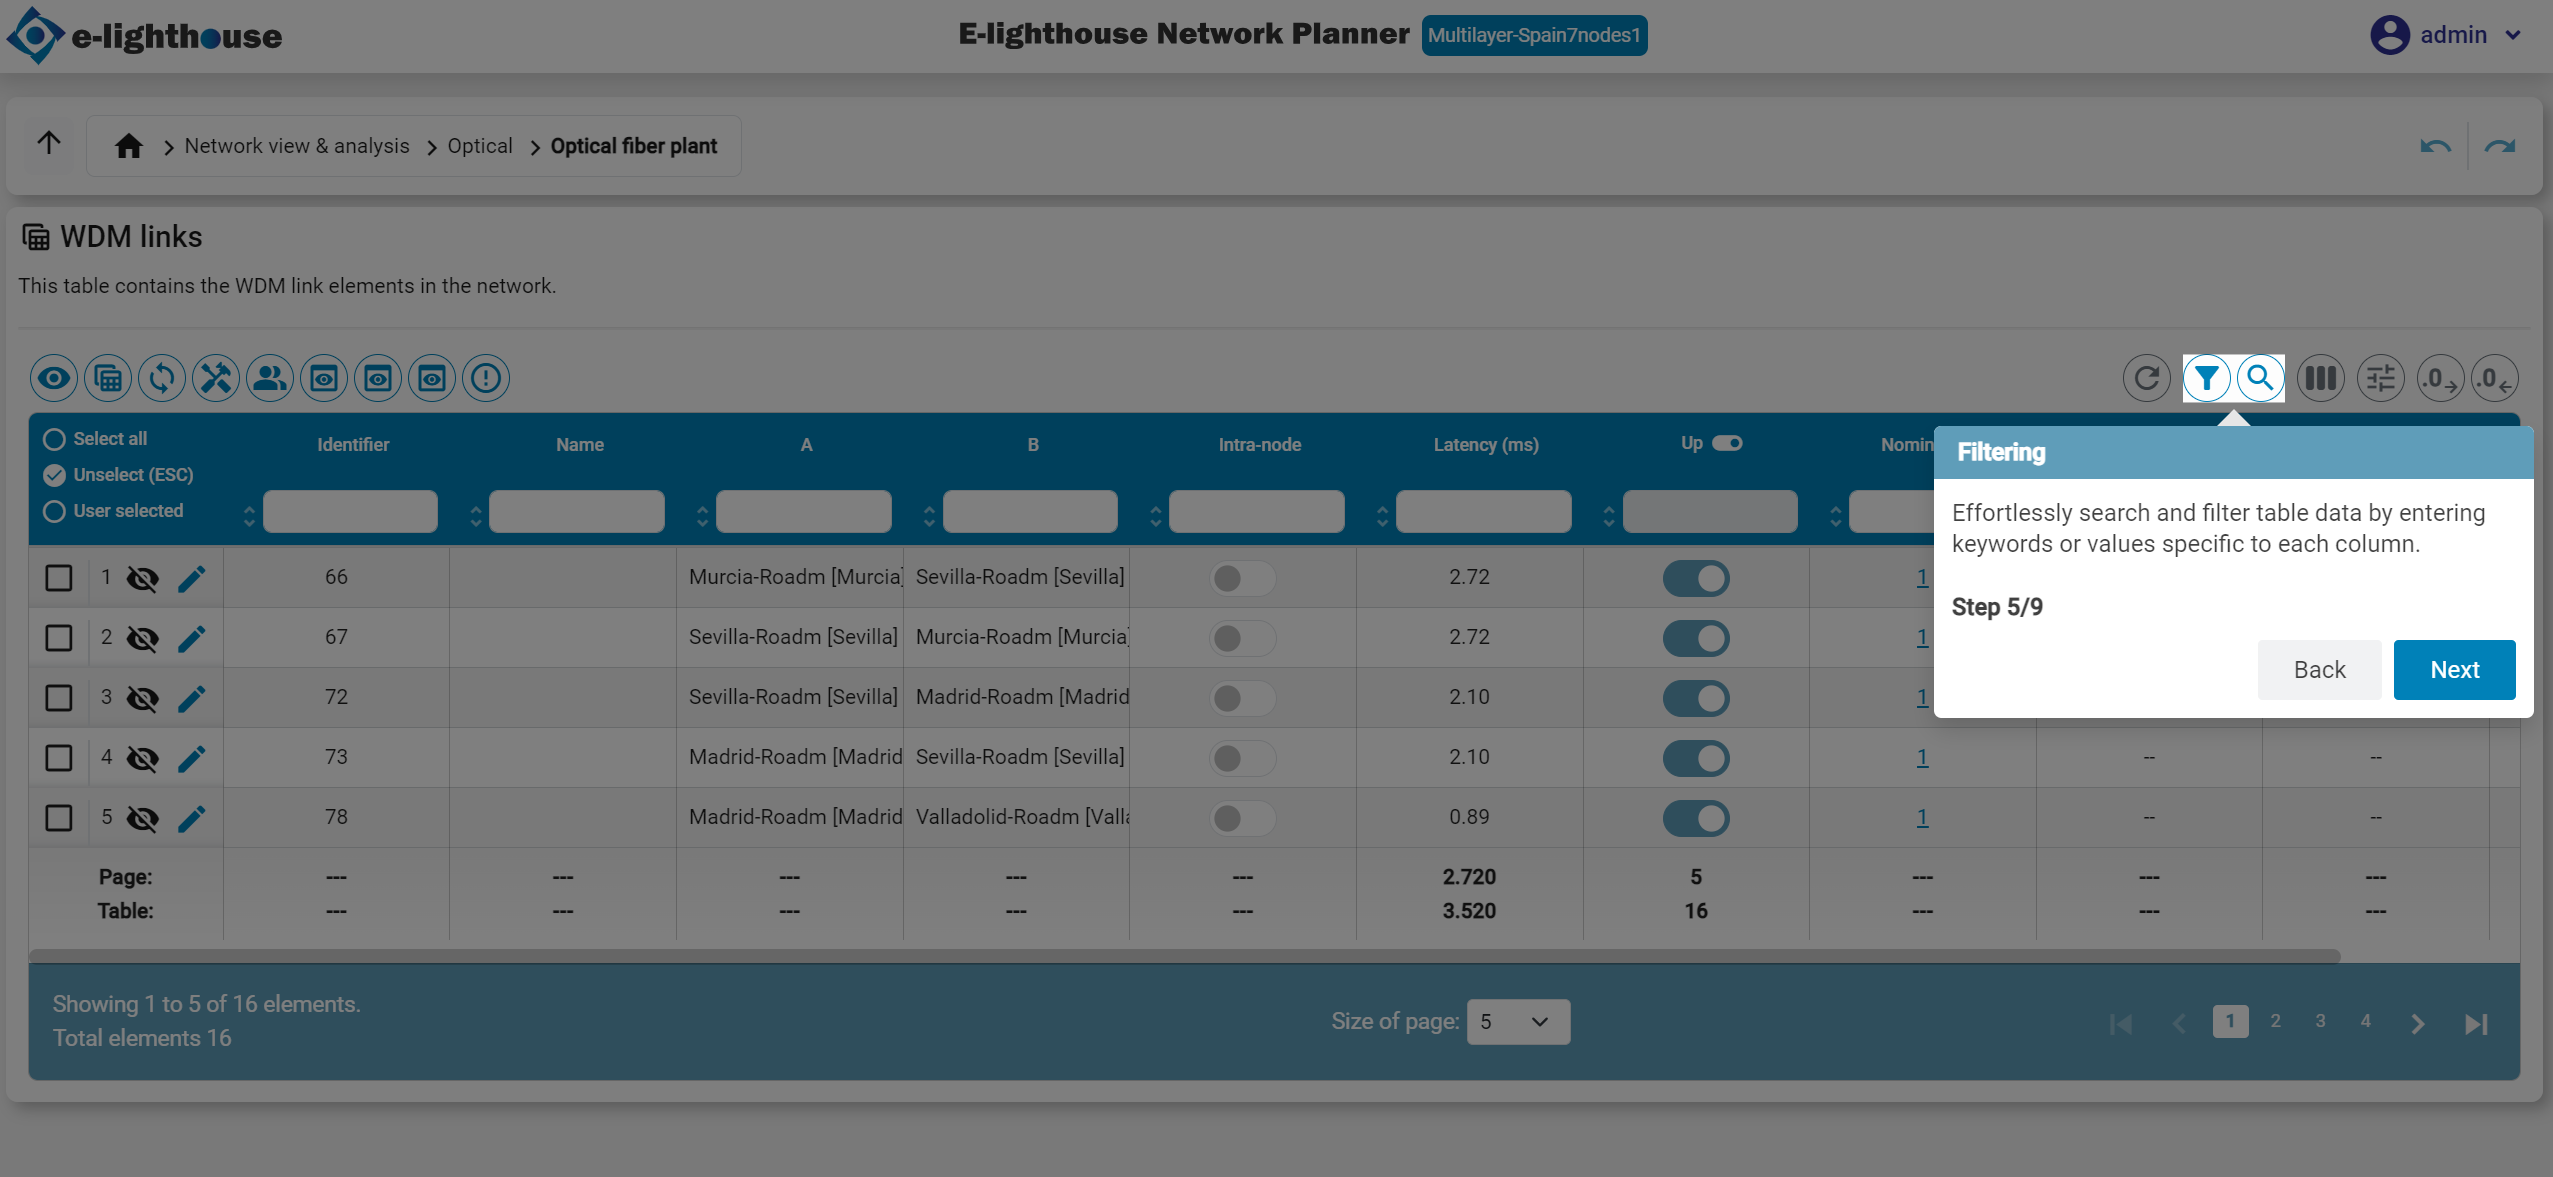
Step 8 of 10: Filtering
Filter table data by typing values or keywords in the header input fields. Filters apply per column.
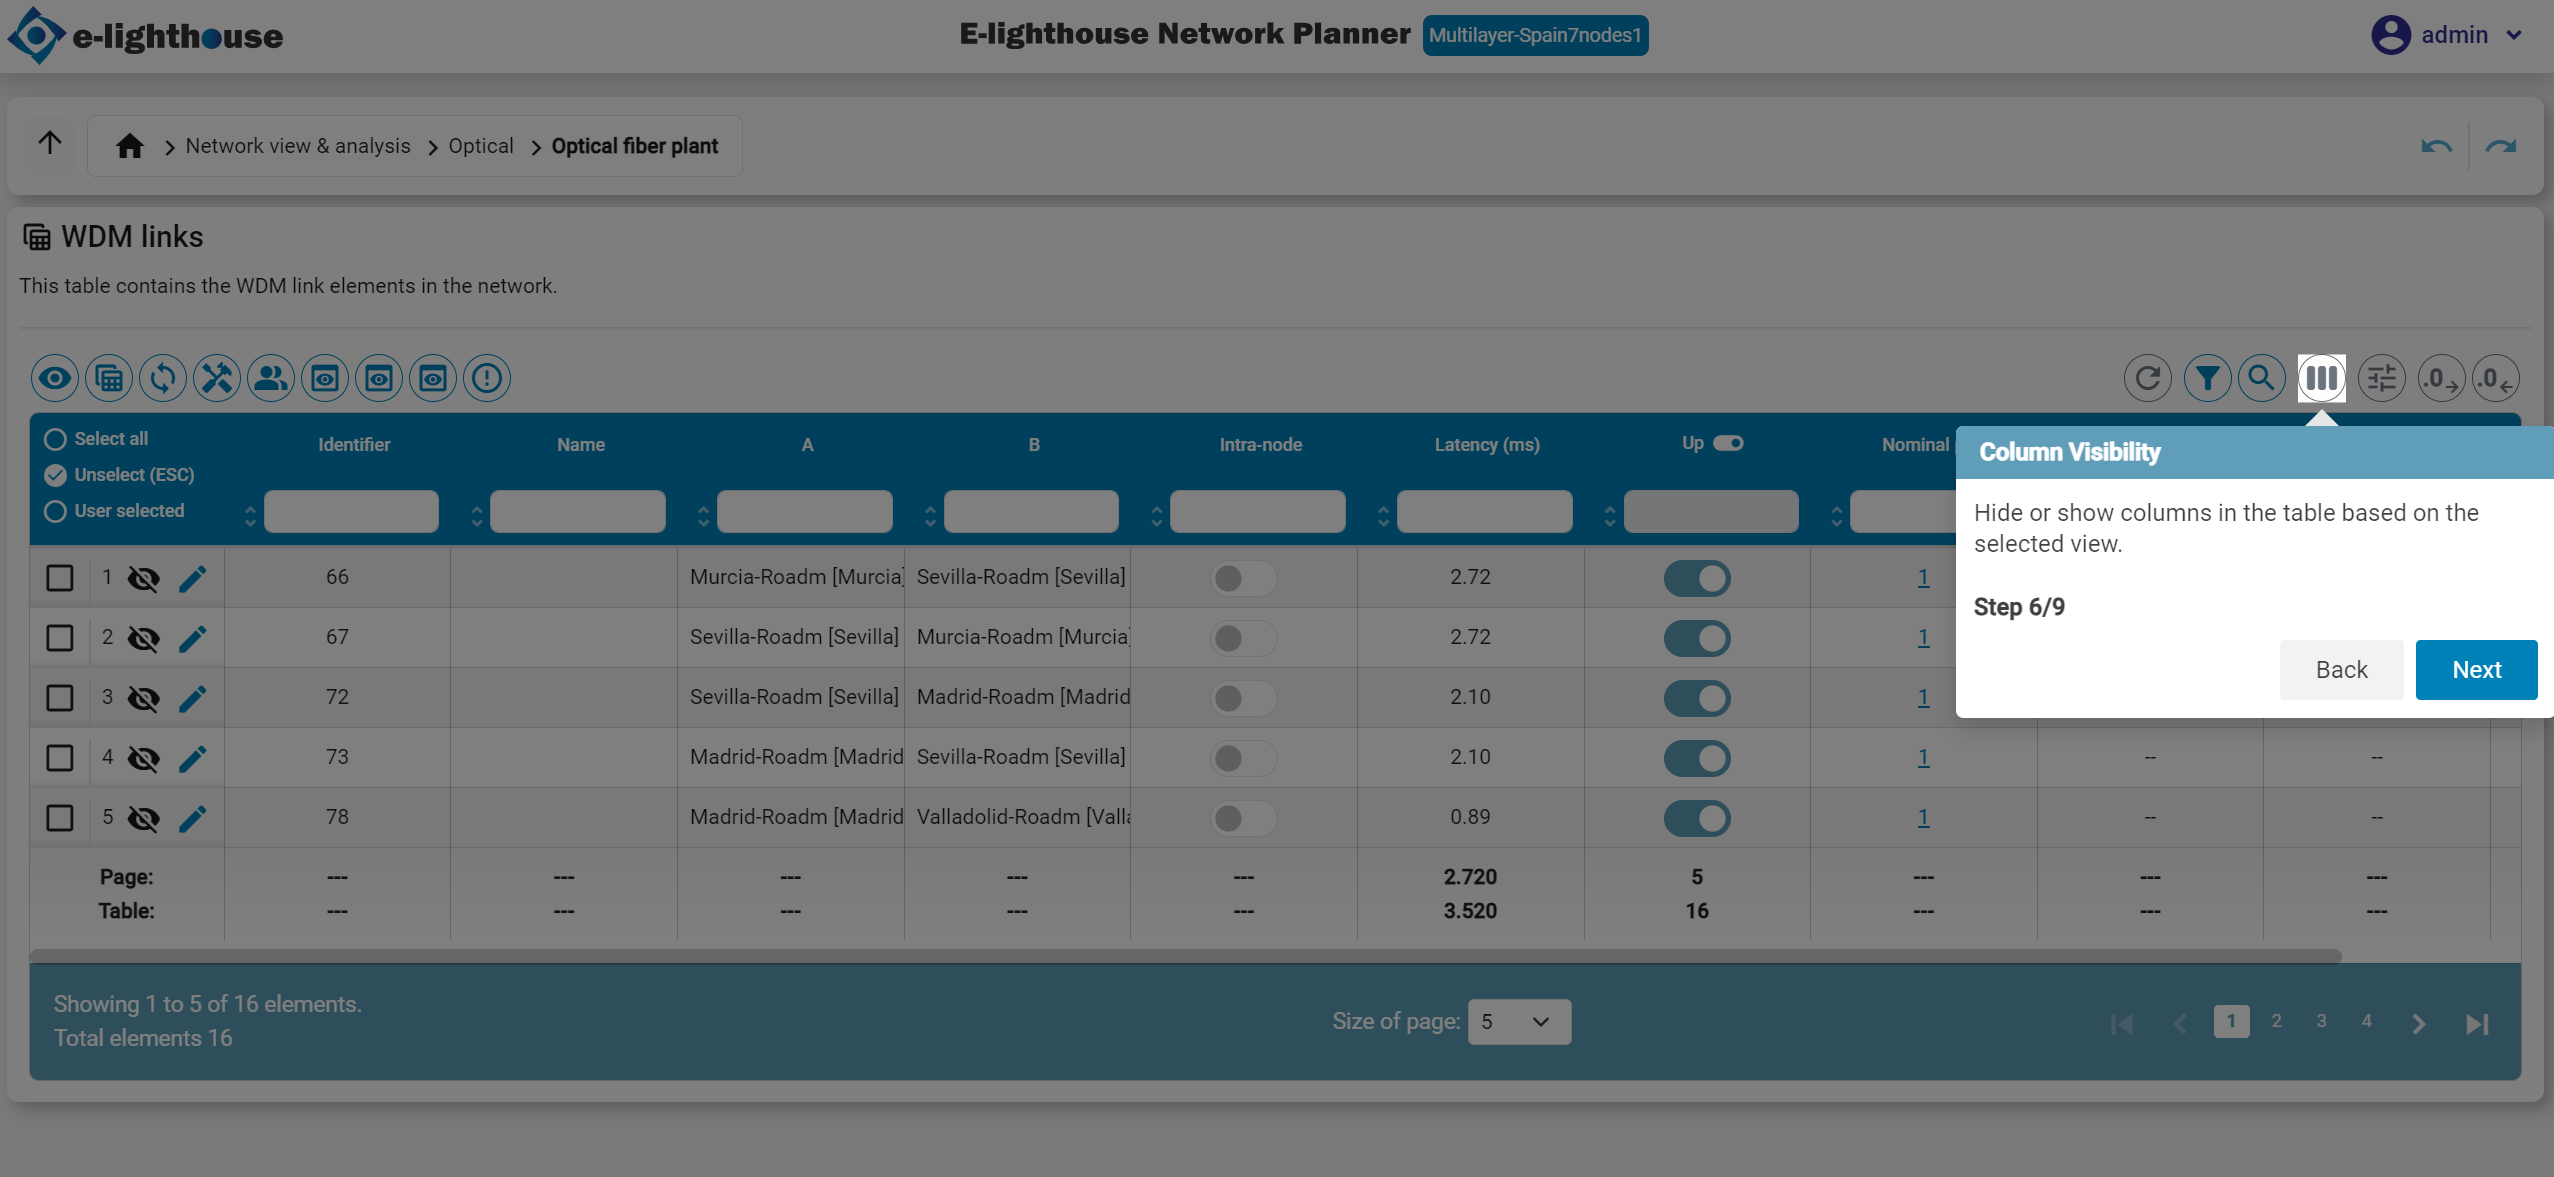
Step 9 of 10: Column Visibility
Show or hide columns in the current view based on what you need to focus on.
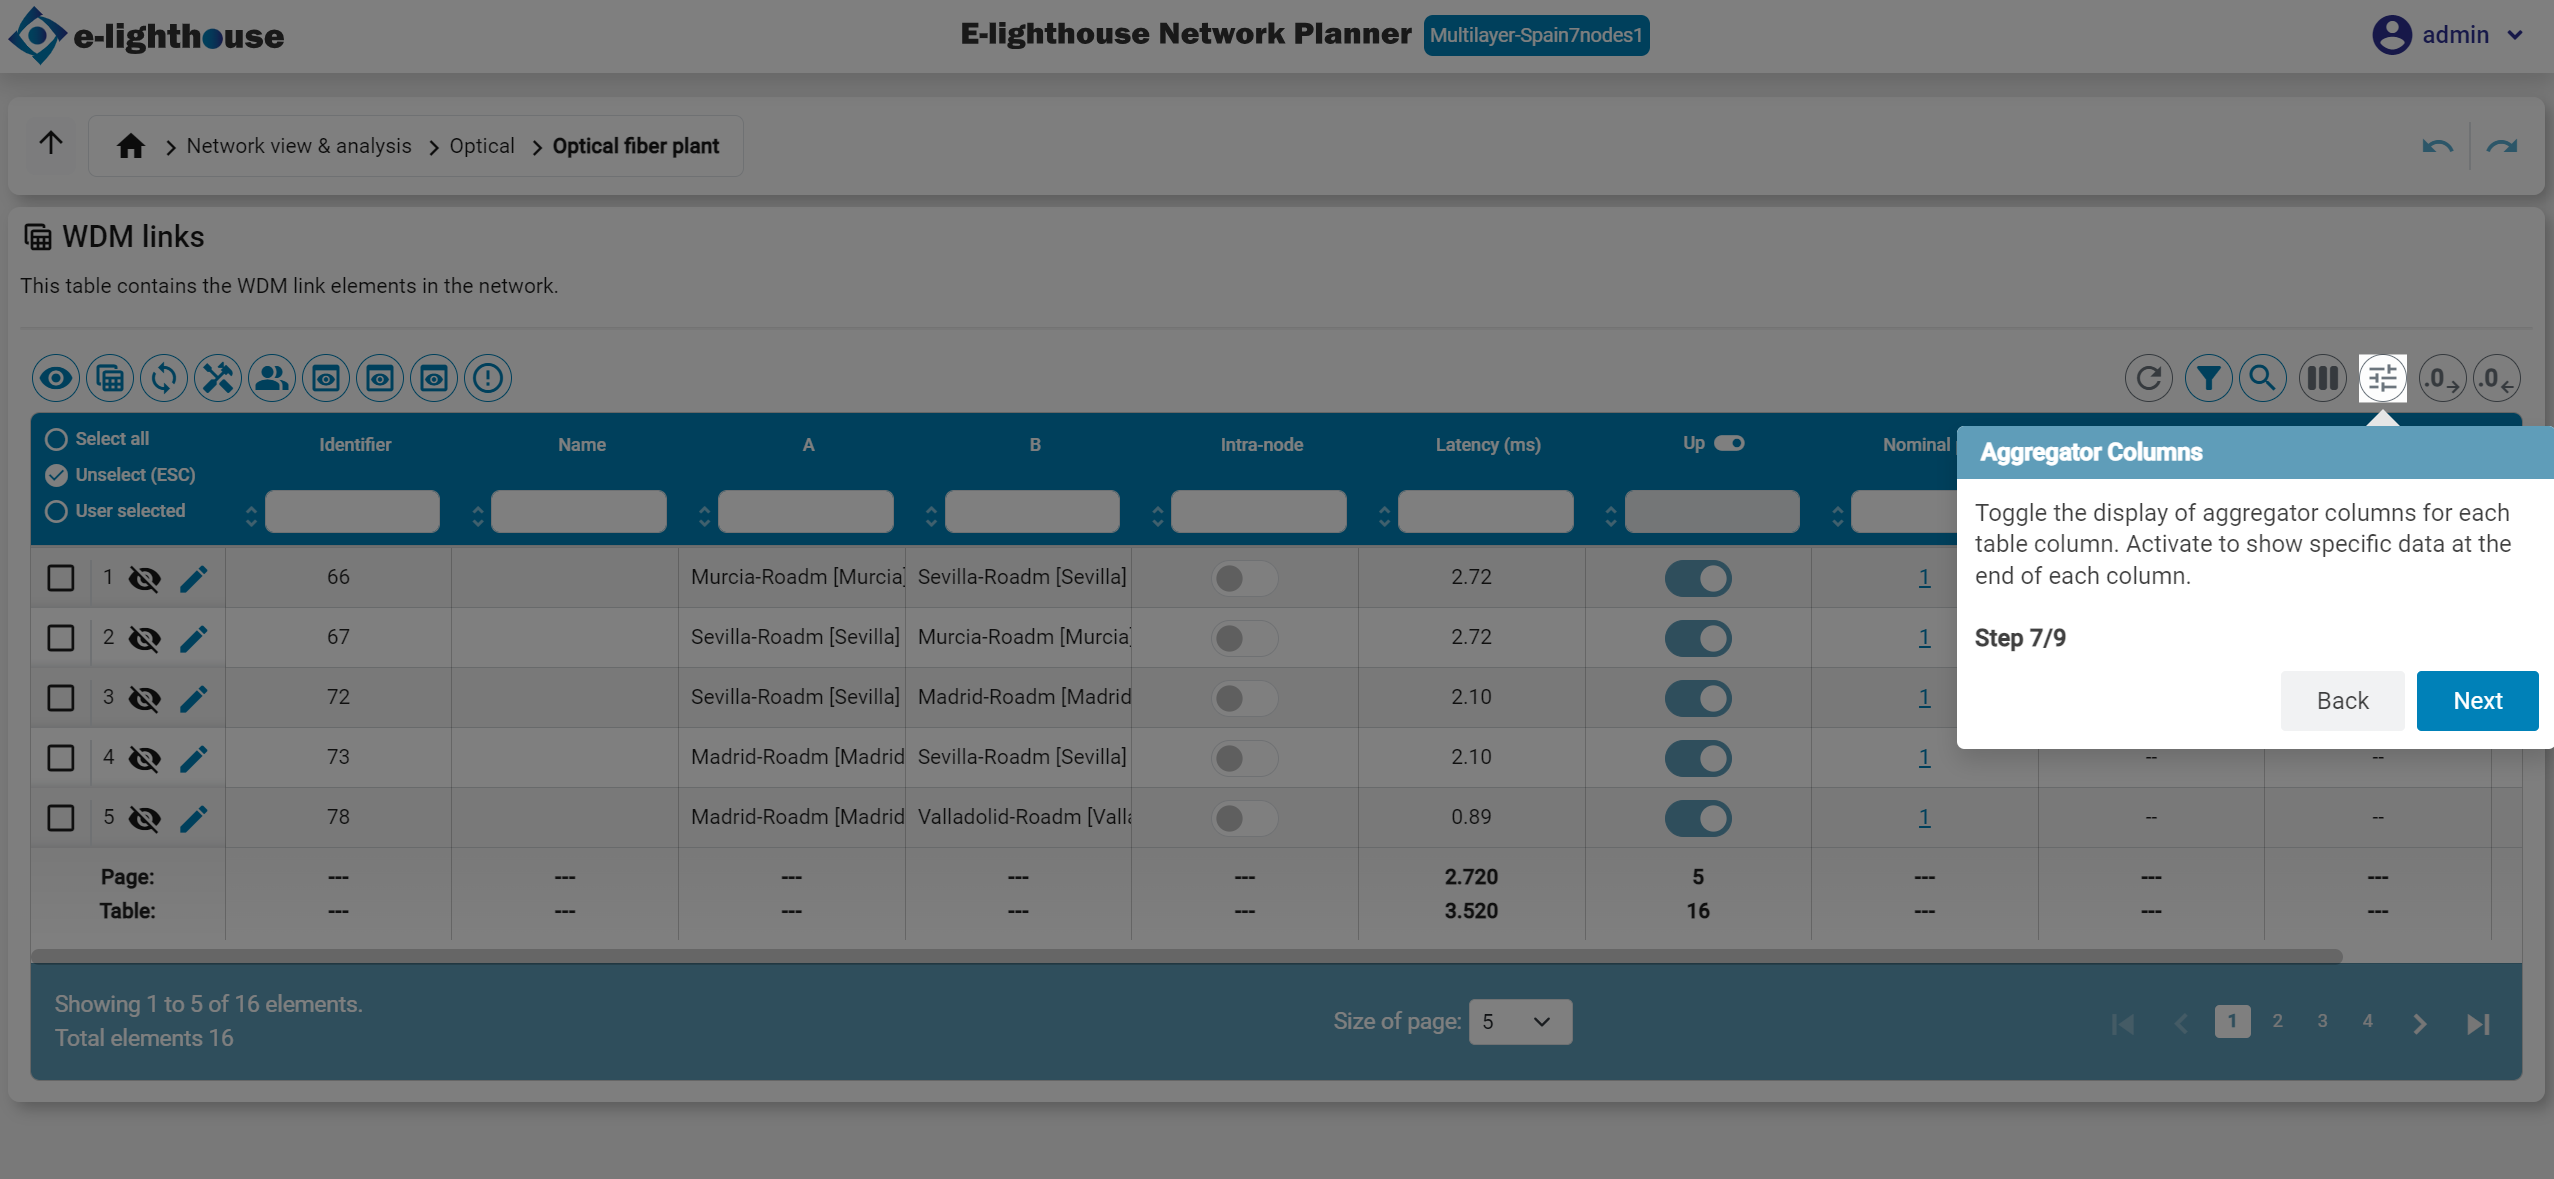
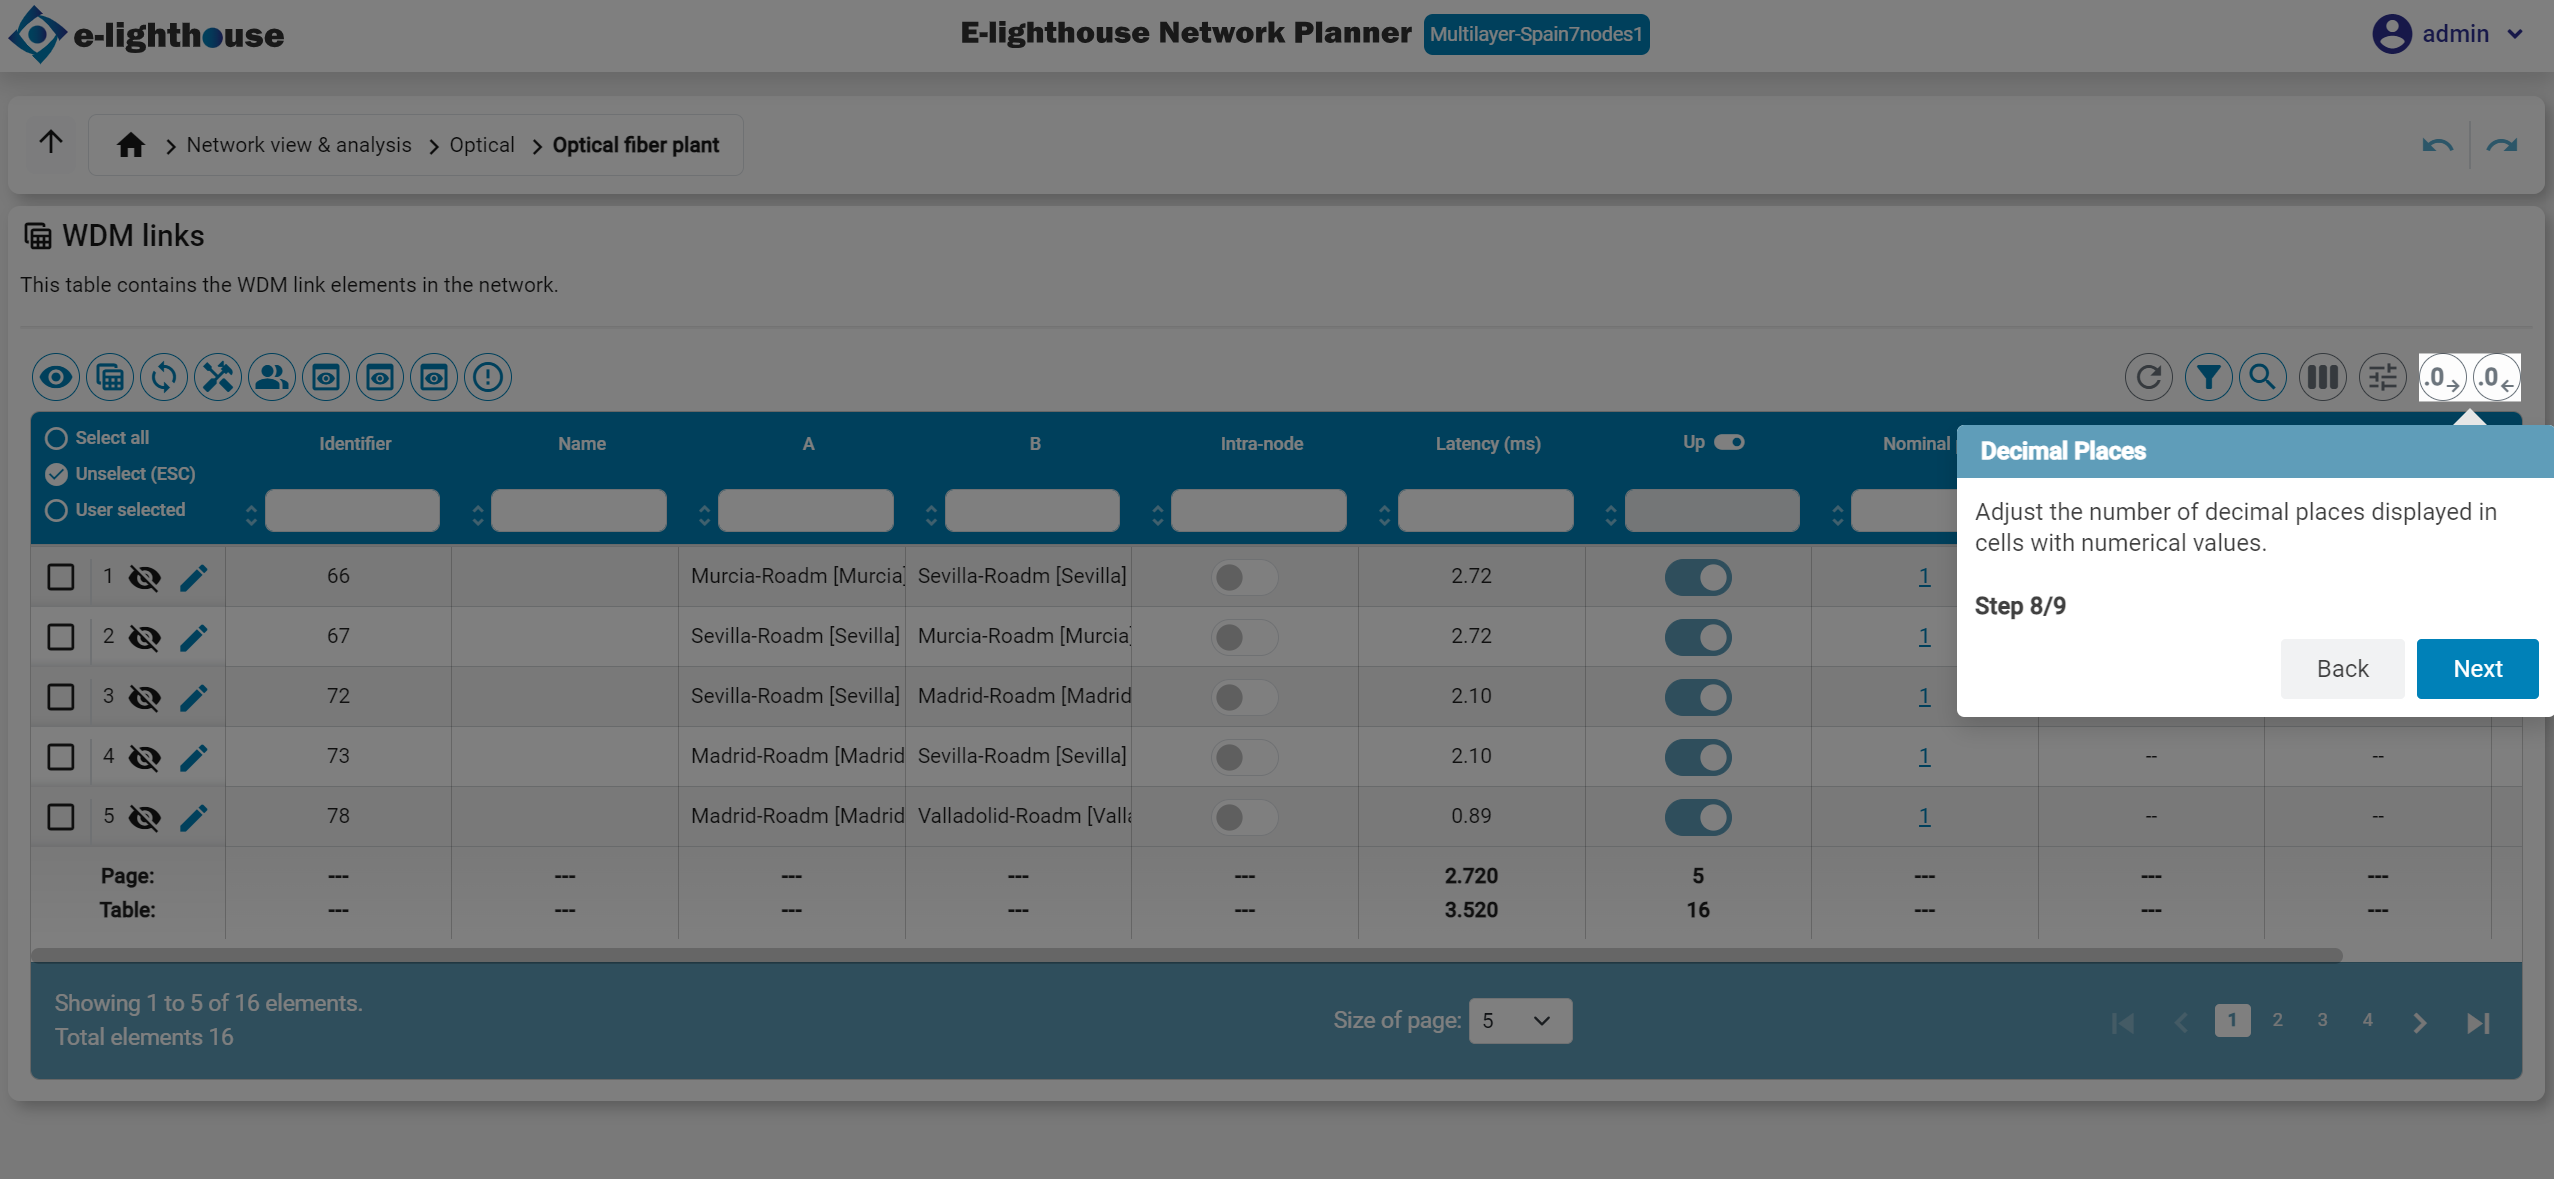
Step 10 of 10: Aggregator Columns & Decimal Places
Toggle the display of aggregator columns to view summary data (like totals or averages), and set how many decimal places are shown in numeric cells.
🔜 Next Step: Create Your First Network Design
Now that you're familiar with the interface, you're ready to build your first network!
🛠️ Learn how to start from scratch or modify an existing layout.
Create a Network Design →